
Strangely enough, the importance of hand washing during the COVID-19 pandemic has reminded me of the importance of data cleaning for effective data science. Similar to hands, data can be trusted only when it has been cleaned thoroughly and methodically.
And the progression of the pandemic provides a good example of how data cleaning works. The coronavirus is a worldwide problem that has led to many important questions that need to be answered with data. This data is so important that multiple coordinated efforts across the world do nothing more than collect, curate, and update data about the disease.
The three most popular and reputable sources of COVID-19 data are the European Centre for Disease Prevention and Control (ECDC), Oxford University, and Johns Hopkins University (JHU). Each data repository is run by a reputable institution, actively curated and maintained, frequently updated, and has API access. However, even these data sources can benefit from cleaning.
Using these datasets as examples, here's my five-step data cleaning process. (Unfortunately, unlike hand washing, it is almost never completed in only 20 seconds.)
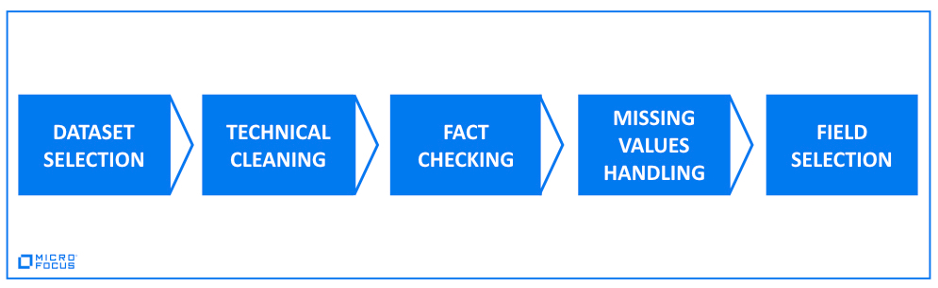
1. Select your dataset
Before you get to cleaning, you must establish that the dataset you've chosen is the best available. If you have only one dataset, you have nothing to discuss or decide, and you can move to the next step.
But if you have multiple datasets, it is essential to select the core dataset. The majority of answers you're looking for should come from it. Use the other datasets as supplementary, supporting information.
How can you identify which is the core dataset? Ask yourself:
- Can this dataset give me an answer to the problems I'm aiming to solve?
How trustworthy/reliable is the source of the dataset?
How accurate/precise are the methods used to collect the data?
How complete is the dataset?
Choosing the right core dataset is important because even the most sophisticated model produces results that are only as good as the data that you throw at it.
All three major COVID-19 data sources contain tabular datasets with numbers of confirmed cases and fatalities per country or smaller territorial units. These statistics are updated daily. In addition, the ECDC data provides information on population.
The Oxford dataset includes detailed information on a wide range of interventions. It also includes several unique indexes that summarize government and economical support, health care potential, etc. Oxford also compiled time series for each of the key features. JHU offers more granular data for the US as well as time series for confirmed cases and the numbers of deaths and recovered patients.
But the data doesn't always agree. Local definitions and explanations for terms such as "interventions" can vary among the three databases, and testing backlogs can also play a role in when data is recorded.
Each of the sources has datasets that contain numbers of fatalities and recorded cases, as well as some information on interventions. The effect of interventions on cases is less delayed and less influenced by additional factors than on deaths. Hence it is natural to lean toward using case count data for the analysis.
However, a number of the cases for a region per day will be influenced by the local definition of the case, test availability, backlog, and actual dates when the results of the tests were released. Dates with no recorded cases that are then followed by dates with two- or threefold increments from the previous number are suggestive that a backlog in testing or result releases was tackled over that period.
In contrast, the number of fatalities is much less disrupted by these factors, since death is recorded on the date the patient dies and less limited by things such as test kit availability. The confidence of specific values within the dataset can be improved via observing correlation with total regional death counts and other supplementary datasets.
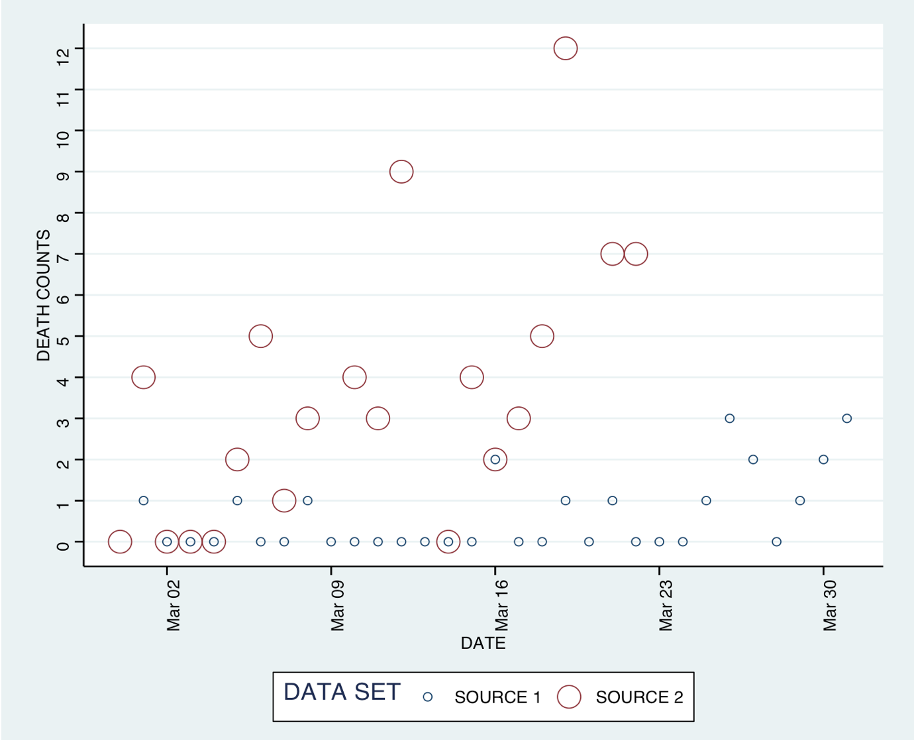
One simple data sanity check is to compare the counts. The daily death counts per country are identical from all three sources, but the numbers for confirmed cases differ in multiple entries. For instance, on January 31, JHU and Oxford recorded three cases in Canada, but the ECDC found zero. There are other examples of this.
2. Technical cleaning
Now that you've selected your core dataset, you're ready to do a technical cleaning. This does not require in-depth knowledge of the domain or data science techniques. However, it is as important to the analysis as a stable foundation is for a house.
Technical cleaning usually begins by surveying the data with simple yet effective summaries and sanity checks, validating the overall structure of the data, correcting the typing of the fields, formatting, and ensuring completeness of the data.
Zooming in on the data with additional field-by-field investigations, the number and nature of investigations will greatly depend on the specific content and its structure. Nonetheless, there are many pain points, specific to the type of data in the field, that usually must be addressed.
Data fields that you need to clean can be divided into three major classes: text, numeric, and temporal.
Cleaning text data
Let's start with the text field, where data is represented as a string of characters. When you first load a dataset, you'll see many text fields; many tabular-data packages use that as their default mode. For instance, if a field contains multiple data types, that field will be processed as a text column.
So start by locating mistyped fields, locating erroneous values, and converting them to suitable types.
As an example, in the JHU dataset, variation among date formats in the "Last Update" field resulted in it being read as text data instead of a data field, as you would have hoped. That needed to be cleaned so that each date was in a consistent, correct format.
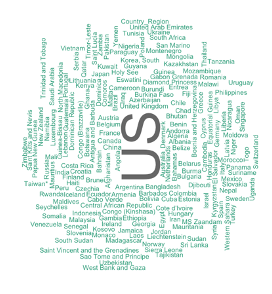
Other common issues to watch out for include encoding detection errors, incorrect spelling, invalid characters and symbols, quotation marks, incorrect spelling, and variations within entries. For instance, in the various COVID-19 datasets, the United States may be coded as "US," "USA," "United_States_of_America," and "United States."
For analytical purposes those entries should be normalized to a common string representation.
Cleaning numeric data
The next common data class is numeric data. Typical issues with numeric fields include integer overflow, round-off errors, equality, computational instability and other limits of machine precision, as well as the wrong numeric data type.
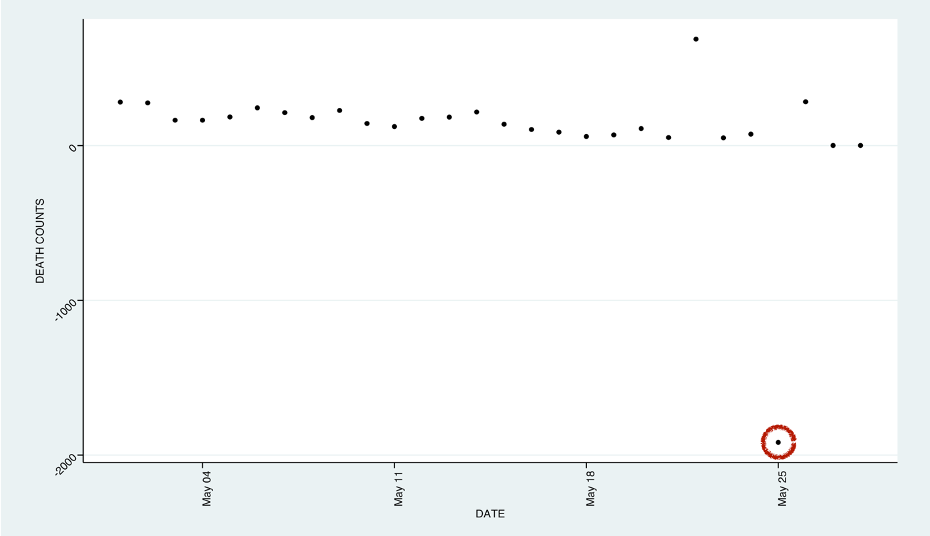
For instance, for death counts, a number greater than zero is expected. But on May 25 in Spain, the ECDC dataset reported a negative number of deaths: -1,918. Negative values in a death count field is an obvious error in the data and should be corrected or excluded during the analysis.
Some numeric errors are more obvious than others. If negative counts are on one side of the spectrum, then integer overflows and abstraction leakage are on the other end. You can spot an abstraction leaking error when you combine an equality check with calculations performed on mixed numeric types.
For folks who want to dig deep into the numbers, calculate "5.0 - 4.3" and then check that the result is 0.7. Despite our expectations, we get FALSE. The source of this incorrect output is abstraction leakage, which reveals the limitations of technical representations of the data to a user. These issues can propagate in calculations that involve double-precision numbers that drastically differ in magnitude (more than eight orders of magnitude apart).
To resolve this issue, apply normalization techniques and perform similarity checks within a defined tolerance.
Cleaning temporal data
Dates and time stamps, both examples of temporal data, are commonly represented as text fields. You often have to convert them into a POSIX-compliant date object as part of the cleaning process. During this conversion or initial ingest, you need to take into account multiple factors: differences in date and time formats (including regional differences), leap days, time zones, and daylight saving times.
This normalization is particularly important if the work includes multiregional datasets that are collected by a variety of sources. Failure to take this into account will result in data that looks pristine yet conveys erroneous information and will cause issues that will be hard to trace in the future.
For example, the various COVID-19 datasets have at least five different date field formats: "20200125," "2020-01-25," "1/25/2020," "2020-01-25T23:59:59," and "2020-01-25 23:59:59." A function that handled multiple format representations was applied to ensure proper conversion for all encountered formats.
3. Check your facts
As with information on social media, you need to fact check your dataset! In the third step, you need to validate the data with a domain expert. This is an exploratory process, comprised of steps such as:
Drill up and down within the data
Plot visualization of different sections of the data
Calculate summary statistics
This is an iterative process in which you are refining both your data and your questions, while also gaining a deeper understanding of the use case as well as the data at hand. Along the way, we often find additional errors in the dataset.
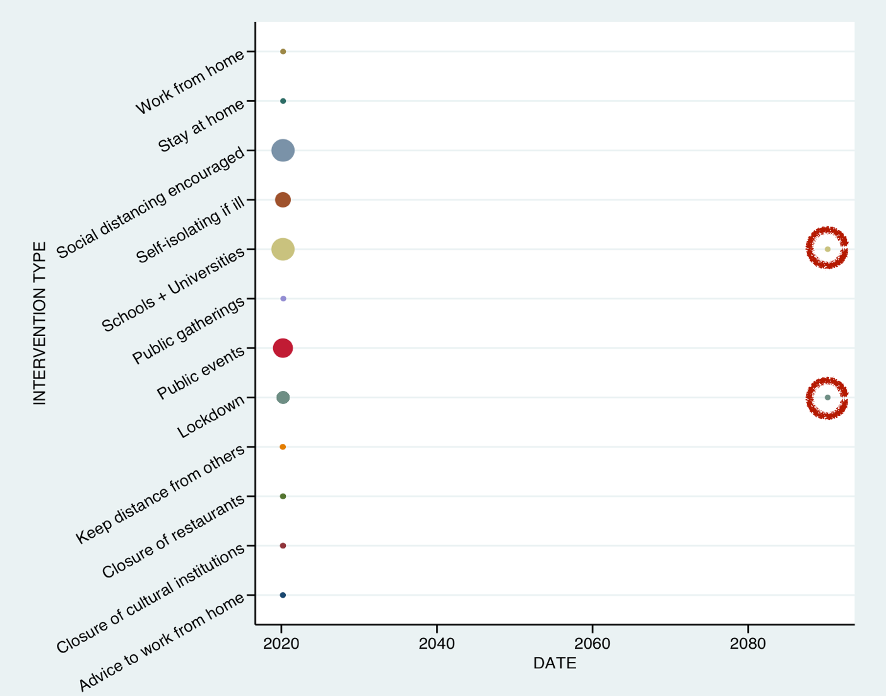
For instance, a closer look at the time frame of COVID-19 interventions revealed that the dataset contains a few records that contained time stamps from 50 years into the future! The data format of the record was technically correct (it was a valid date, in the correct format), but unless the data was compiled by Nostradamus, these dates were obviously erroneous.
This date is also an example of an outlier, a value far from the expected range. The validation of outliers is an essential part of this stage. You can perform checks to determine if the outlier values produced by the data collection process are valid or not. Similar checks should be performed to evaluate the soundness of duplicate entries.
Comparing your dataset with other datasets is another excellent way to increase your confidence in the data. For the COVID-19 datasets, when my team joined subsets of all three and compared three columns they had in common—date, country, and case counts—they still found inconsistencies.
In fact, over 100 rows had different case numbers among those datasets, and so those values are potentially incorrect and should be marked as erroneous until confirmed otherwise.
4. Address missing values
In the fourth step, you address missing and erroneous values that were identified earlier. You should remove or repair a record with missing or incorrect values. Removal is easy enough, but if the relative number of the removed records is significant, deleting them will deplete the quality of the dataset.
Also, removing the values may affect the conclusions drawn from the data if the removed record represents a specific subcategory of the data. For instance, if a country had a unique date format and you removed all rows with strings that failed to convert to proper dates, you would lose all the data for that country.
The alternative—recovering missing and erroneous data—can be tricky. The method to repair will demand case-by-case investigation for some fields but can be accelerated by multiple well-researched imputation techniques in others.
The best method will depend on the statistical qualities of the data, performance requirements, error tolerance for the results, an algorithm that will process the data, and the strength of associations between the present and absent data, etc.
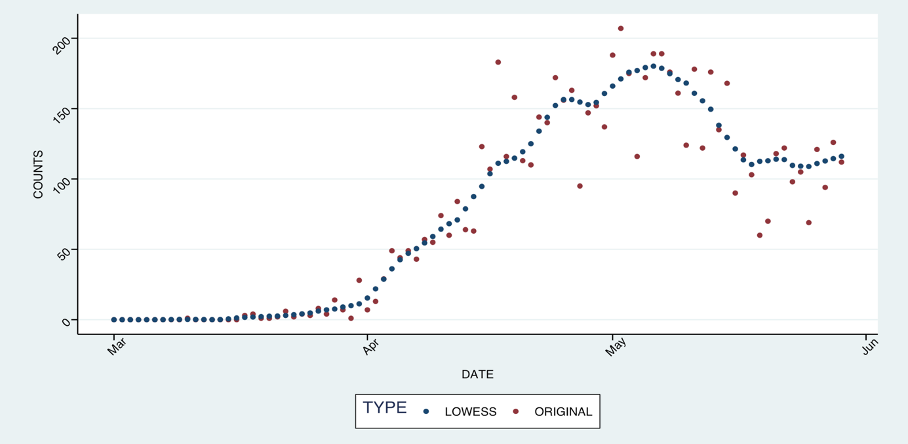
For COVID-19 data, you will encounter multiple dips and spikes in reported death counts that were more explainable by the data collection process than by a true trend.
If you had fed that data directly into a model, it would have been harder to discover the actual trend and make predictions. To optimize the quality of predictions, you must remove as much of that noise as possible—though manual record-by-record cleanup of the data is time-consuming and unreliable.
Various smoothing techniques would fit the bill for this instance. One of these techniques is LOWESS (LOcally WEighted Scatterplot Smoothing), a popular method that smooths outliers based on their neighborhood. When I applied this technique to the COVID-19 counts, LOWESS significantly improved the quality of the data and predictions.
5. Select data fields
The final step of the data cleaning process is choosing the best fields for analysis. This is critical, since it provides the solid foundation for feature engineering and for creating an effective predictive model. You must qualify suitable fields from a domain expert and specific use case perspective, from the mathematical and algorithmic perspective, and from the ethical perspective.
Keep it clean to get better results
Data is of critical importance to any analysis, but for that analysis to be effective, your data needs to be clean. I have yet to encounter a perfectly clean dataset. Some amount of cleaning should always be expected.
Lazy or rushed cleaning is unlikely to produce satisfactory results, no matter how sophisticated and brilliant the model. The results of any model are only as good as the data thrown at it.
Keep learning
Learn from your SecOps peers with TechBeacon's State of SecOps 2021 Guide. Plus: Download the CyberRes 2021 State of Security Operations.
Get a handle on SecOps tooling with TechBeacon's Guide, which includes the GigaOm Radar for SIEM.
The future is security as code. Find out how DevSecOps gets you there with TechBeacon's Guide. Plus: See the SANS DevSecOps survey report for key insights for practitioners.
Get up to speed on cyber resilience with TechBeacon's Guide. Plus: Take the Cyber Resilience Assessment.
Put it all into action with TechBeacon's Guide to a Modern Security Operations Center.
