The concept of observability has caught fire in the last few years, both in DevOps and monitoring circles. You may already be familiar with observability operations, which include logging, tracing, and displaying metrics. But how do you do those three things well?
Here's a list of current and relevant online resources to help guide you on logging, tracing, and metrics. Go back to your team armed with these resources and you're sure to spark some ideas on how to handle your own monitoring challenges.
Intro to logging, tracing, and metrics
Logging vs Tracing vs Monitoring
If you're looking for a quick introduction to the three pillars of white-box monitoring/observability, Dr. Phil Winder's post is just the thing. He describes each pillar while also providing his own opinions on their advantages and disadvantages. The instrumentation and monitoring pillar is also called "metrics" by some.
Monitoring in the time of Cloud Native
For the most comprehensive look at the modern state of observability and monitoring, Cindy Sridharan's content is required reading. The article introduces the concept of observability, defines the three pillars of modern observability—logging, request tracing, and metrics collection—and describes when you might consider using each pillar. "Logs and Metrics" is another good post by Sridharan on just those two pillars. It's shorter, but it gives more concise information, not all of which is in the other article. She has also written a free e-book on this topic called Distributed Systems Observability.
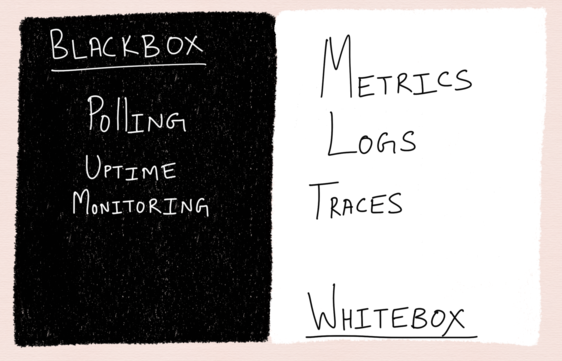
Black-box vs. white-box monitoring.
Metrics are Dead?
After attending the Monitorama conference, Paul Dix shared some useful opinions and advice on the relevance of metrics (what he calls "regular time series") in modern monitoring. This article shares some helpful angles for looking at each of the three monitoring pillars. It concludes that while tracing is more useful for microservices, in more common monolithic architectures, metrics, events, and logs are king.
Logging
An introduction to logging for programmers
FreeCodeCamp is a great publication to learn from if you're a beginner developer. Anyone dealing with operations and debugging should know how logging works, and this article is a wonderful start for anyone who hasn't learned how to do it. The author, Stefanos Vardalos, defines diagnostic and audit logging while also sharing some example logging tools for back-end and front-end development.
Logging — The Ultimate Guide
This resource isn't just one article, but an entire site. It was created by Loggly, a log management vendor, but the content is vendor-neutral and community-maintained. There are nine sections: .NET, Apache, Java, Linux, Node.js, PHP, Python, Systemd, and Windows. Each section has a guide to the basics and discussions on how to analyze or parse logs, how to troubleshoot common issues, and how to centralize or aggregate logs in a distributed system.
Un-broken logging — the foundation of operability
Matthew Skelton shares excellent insights on modern logging in this talk. The key, he says, is using the right transaction identifiers so that calls can be traced across components, services, and queues. He also has another good article on why and how you should test logging.
Lies My Parents Told Me (About Logs)
The Honeycomb.io blog is an excellent place to find log management content. Many of its posts focus on promoting structured logging, and although Honeycomb.io is a product vendor, many posts are product-agnostic.
Charity Majors, a co-founder of Honeycomb.io, wrote the "Lies My Parents Told Me" post, which explores 11 assumptions about logs and why they're bad.
Other strong articles from the blog include "You Could Have Invented Structured Logging," an explanation and demo of testable structured logging with fewer than 30 lines of code; "Simple Structured Logging with NLog," another example of structured logging using the .NET logging library NLog; and "From 1 service to over 50 today," a case study of how Snyk built a logging system that allows any developer on the team to efficiently troubleshoot any type of issue while working remotely.
Logs and real-time stream processing
This article is a free excerpt from the book I Heart Logs: Event Data, Stream Processing, and Data Integration, by Jay Kreps. The book was favorably reviewed by veteran developer and blogger Ben Nadel. The article is also an updated subsection of Kreps' earlier, more comprehensive post on log processing, "The Log: What every software engineer should know about real-time data's unifying abstraction." These resources all look at logs from the perspective of the challenge of processing and storing them, providing deep knowledge about stream processing concepts as they apply to log management.
"It turns out that 'log' is another word for 'stream' and logs are at the heart of stream processing."
—Jay Kreps
Introducing Network Error Logging
Douglas Creager provides a short introduction to basic network monitoring theory. He explains a typical technical strategy that involves the collection of server logs and client-side requests to help you get visibility into what's happening in the black box that is the network.
Logging v. instrumentation
Peter Bourgon has some excellent, concise advice about what you should log and what instrumentation you should build. The post helps you ask the right questions regarding logging and metrics while understanding the potential pitfalls. Learn what metrics make sense, when to start instrumenting your code, what you should log, what level of detail you should log at, and where your logs should go.
A guide to logging in Python
For application-level logging, you'll want to look at the documentation of the language and framework you're using to see which built-in logging capabilities they have before you start looking for external libraries. Some languages are easier to work with in terms of logging than others; I've heard developers call Java logging "a mess" on more than one occasion. So I shared a Python-based logging introduction for this article, since Python is widely regarded as an excellent learner's language. In this tutorial, Mario Corchero dissects the Python logging module and shows you how to use, configure, and extend it.
Building A Central Logging Service In-House
Akhil Labudubariki, an engineer at BrowserStack, shares a story about how his company built a central logging service tool in-house. The logging service tracks key product metrics as well as several session health metrics, from API response latency to network performance.
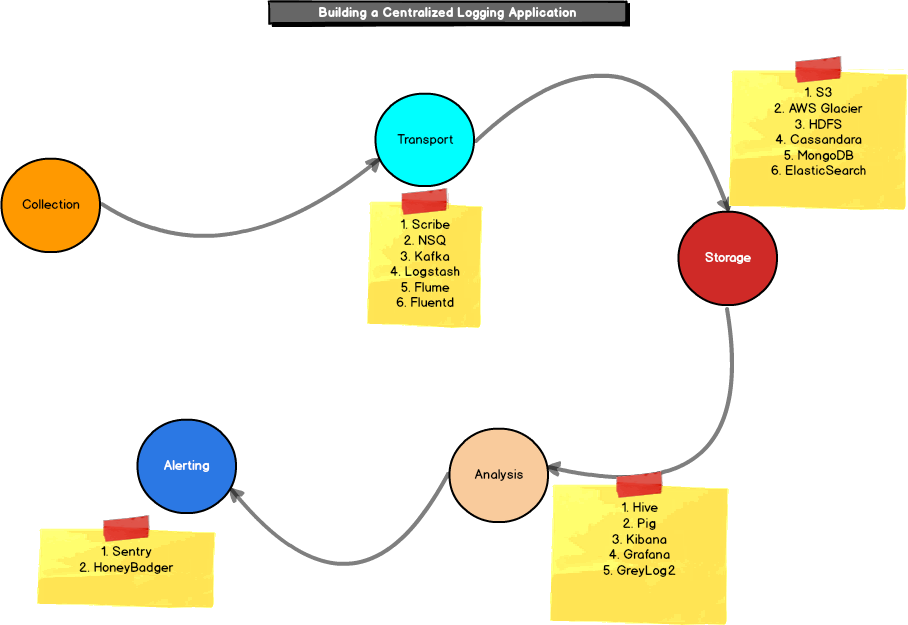
Building a Centralized Logging Application
Vikesh Tiwari wrote an interesting architectural outline of the open-source software you could use to build a centralized logging application. He goes into detail on log collection, transport, storage, analysis, and alerting capabilities that you'd need to consider. (He never did write part two of this.)
The flow of a centralized logging application with potential open-source tools.
Transitioning Logging and Monitoring Systems at The Economist
The Economist had transitioned from a monolithic architecture to microservices, but the monitoring and logging systems couldn't keep up. In this post, Kathryn Jonas, the lead engineer at the newspaper, shares the story of how her team ran a hackathon to build standardized structured logging across all service teams.
OWASP Logging Cheat Sheet
Logging in the context of security operations is a topic that could fill a whole other article. When building your logging architecture, make sure to include security experts or advocates in the organization. Logging is critical to detecting attacks and intrusions. A good place to start learning about logging as it relates to security is with this OWASP logging cheat sheet, along with its other security operations resources.
When logging causes security incidents; What we learned from GitHub and Twitter
Recently Twitter and GitHub accidentally logged sensitive information—including passwords—in their applications or server logs. How can you make sure that your logging efforts aren't also a security hazard? Read Scott Helme's piece on how Report UI plugged this hole in its system's security.
"Logging is great and it provides valuable information but it has to be done with caution."
—Scott Helme
Designing microservices: Logging and monitoring
This piece, from the Azure documentation, mostly gives helpful, product-agnostic advice about logging and tracing for microservice architectures. The resource provides a list of important questions you need to ask as you build a logging infrastructure, and it includes advice on how to implement distributed tracing that monitors the flow of events across services. Finally, it provides some technology options for implementing the strategies it outlines.
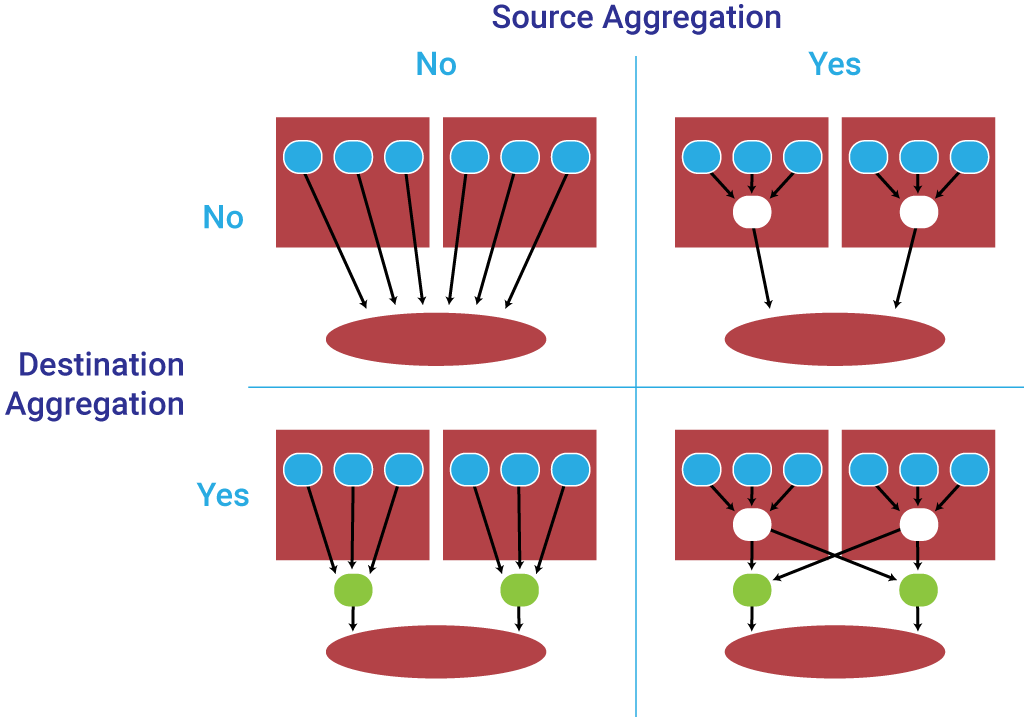
Distributed Logging Architecture in the Container Era
This article outlines the new requirements for logging in distributed systems and containerized microservice architectures. Along with explaining the new challenges and requirements, the article provides patterns for aggregating logs and for scaling up or scaling out your logging architecture.
Source vs. destination log aggregation.
To boldly log: Debug Docker apps effectively using log options, tail, and grep
This post by Ryan Davidson is a concise list of tips that show you how to effectively get log data out of Docker containers. The tips teach you how to display all logs, target and follow specific containers, slice and search logs using tail and grep, search logs by time, combine commands, and write logs to files.
Setting Up Logging within Kubernetes
Arve Knudsen shares his route for creating a log management system in Kubernetes on AWS. The setup uses Elasticsearch as a search engine, Kibana as a graphical interface, and Fluentd to transmit the logs. The article includes long code samples. For a more general introduction, check out the documentation on Kubernetes' logging architecture.
Yubl’s road to Serverless — Ops
Yan Cui's employer, Yubl, runs a serverless application on AWS Lambda. In this post he shows how the company set up logging, tracing, and metrics using the ELK stack for log centralization, correlation IDs for tracing, and CloudWatch for monitoring metrics.
Tracing
Dynamic tracing in Linux user and kernel space
Tracing is another major component of monitoring, and it's becoming even more useful in microservice architectures. A few of the previous resources in the logging section covered tracing and often suggested using correlation IDs for tracing transactions through different parts of your microservices architecture.
In addition to that strategy, you'll want the operations side to have some decent knowledge about tracing at the OS level. This article by Pratyush Anand on dynamic Linux tracing provides an introduction for the average user, starting with some definitions and finishing with simple examples of how to set a few probe points.
Choosing a Linux Tracer
For Linux tracing, you can't go wrong following the blog posts of Brendan Gregg, a Netflix performance architect who is also the creator of the DTrace toolkit. In "Choosing a Linux Tracer," he helps you decide which tracers (there are a lot!) are your best option if you're a general operations engineer vs. a performance/kernel engineer. For an awesome introduction on how to use a Linux tracer, watch Gregg's 15-minute demo on Linux tracing.
And be sure to check out the rest of Gregg's most popular tutorials.
Linux tracing systems and how they fit together
Julia Evans is another great source of information for Linux tracing and other operations topics. This resource might be even better for beginners, since it takes the perspective of an in-process learner of Linux tracing systems. Her article gives quick overviews for several tools, provides cool drawings for clearer understanding, and generally makes the ecosystem of Linux tracing systems more approachable.
Tools for Software Tracing — Microsoft
If your organization uses Windows Server, you'll need a different set of tracing tutorials. This page from Microsoft's hardware dev center should have you covered, with links to 12 sections about the technical details of Windows tracing.
How to Trace Transactions Across Every Layer of Your Distributed Software Stack
This product-agnostic article outlines the features in modern application performance management (APM) systems that allow you to trace transactions across a distributed system. It explains how to reconstruct a transaction, trace it across the network, and generally use log data to get a full view of your system. Baron Scwartz has a good post to read as a follow-up to this one: "What If You Can't Trace End-to-End?"
OpenTracing: Distributed Tracing’s Emerging Industry Standard
In contrast to the previous article, which promotes commercial APM tools, this post introduces the OpenTracing standard, a set of vendor-neutral APIs and instrumentation for distributed tracing. The author, Nedim Šabić, explains why this is beneficial:
"Traditionally, APM vendors had their own proprietary tracing agents and SDKs that would instrument applications, either automatically (blackbox instrumentation) or by having their users modify or annotate their apps’ source code (whitebox instrumentation). Long story short, this has issues such as vendor lock-in for users, and high costs associated with addition and maintenance of support for an ever-increasing number of technologies and their versions that need to be instrumented for vendors."
Šabić wrote this article to introduce the technical details of OpenTracing, and also wrote three other articles to introduce and compare Zipkin and Jaeger—two open-source tools that implement the OpenTracing standard.
Performance Analysis Reference — Chrome DevTools
When it comes to front-end tracing, you'll have to use browser tools. Google has excellent documentation on how to trace performance issues in Chrome using its DevTools suite. Kayce Basques provides a visual walkthrough of the analysis process and shows you how to read the performance graphs.
Logging is not Tracing
Although this is an older article, the middle section has some useful advice about logging vs. tracing. It explains how each needs to be treated differently in your system architecture and what their goals are.
Metrics
An Introduction to Metrics, Monitoring, and Alerting
In this article, Justin Ellingwood defines metrics, monitoring, and alerting while also clarifying their goals. He also discusses the different types of metrics and the various factors that will affect what you choose to monitor. The article concludes with a short glossary of monitoring terminology.
How to Monitor the SRE Golden Signals
Using Brendan Gregg's USE method, Tom Wilkie's RED method, and the signals from the Google SRE book, Steve Mushero compiles a list of "golden signals" that you should be monitoring. First, he covers his five golden signals and then explains what you should do with them. This article acts as a table of contents for the rest of the series, which illustrates how to get monitoring data from load balancers, web servers, app servers, database servers (he covers MySQL/RDS and Aurora), and Linux servers.
The Cloud Service Industry’s 10 Most Critical Metrics
This article takes a broader scope for looking at critical cloud application metrics, including topics such as security and capacity. Each metric comes with a definition, an explanation of why it's important, and a graphical illustration. The 10 metrics are availability, reliability (mean time between failures and mean time to repair), response time, throughput, security, capacity, scalability, latency, service/help desk, and cost per customer.
The Mon-ifesto
Peter Christian Fraedrich of Capital One writes about his own team's favorite metrics: calls per minute, error rate, response time, and bandwidth saturation. After introducing these four measures, and his views on metrics in general, he continues with two other articles on alerting and graphing and alert responses and post-mortems.
"Gone are the days where engineers wake up in the middle of the night to respond to Nagios alerts on CPU or Memory. Collect everything, alert on four things, correlate everything. We can take this 'shortcut' because if there’s a problem — a real problem — on one of our app hosts, the symptoms will bubble up into one of our four key metrics."
—Peter Christian Fraedrich
Building low-overhead metrics collection for high-performance systems
Gathering metrics always has a performance overhead associated with it. The developers of Wallaroo, an open-source data processing framework, share some of the challenges you run into when trying to reduce the overhead of gathering metrics. The post primarily focuses on the choices the Wallaroo team made when deciding what kinds of metrics to gather and how to display them.
Metric Graphs 101
Displaying metrics in an easily digestible format is half the battle when it comes to observability. John Matson has a great three-part series on graphing metrics that should put you in a position to make better decisions about how you want to visualize your monitoring metrics. The three posts cover time series graphs, summary graphs, and graphing anti-patterns.
Monitoring of GitLab.com
For a deeper look into how a successful web company does monitoring, you can check out GitLab's internal monitoring documentation. Since GitLab follows a doctrine of radical transparency, nearly all of its internal knowledge base is online for all to see. This document gives you an idea of the tools it uses and the processes it has for monitoring, but it's not an article—you'll have to poke around to see if there are any useful ideas you can use.
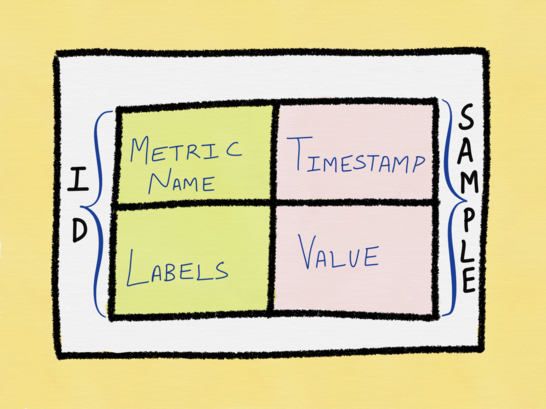
Prometheus Metrics
Prometheus is a popular set of open-source tools and standards for monitoring in the cloud-native space. One of the aspects that make it so popular is its exposition format for metrics, which Cindy Sridharan praises in her "Monitoring in the time of Cloud Native" article. Mateo Burillo's article "Prometheus Metrics" is a good introduction to the simple syntax of Prometheus metrics, illustrating why they've become so popular.
The anatomy of a Prometheus metric.
Lessons from Building Observability Tools at Netflix
As one of the technology leaders at the forefront of the cloud-native movement, Netflix is a great company to take advice from when it comes to observability. This post gives a holistic view of how Netflix addressed challenges relating to logs, tracing, and metrics. Specifically, team members describe how they scaled their log ingestion, built distributed request tracing, improved metric sharing and alerting, improved their monitoring of data persistence systems, and tailored metrics' UIs for different groups.
Need more monitoring resources?
The resources in this article mainly cover conceptual topics and avoid tool-specific examples. But if you're looking for a list of tools for the various facets of logging, tracing, and metrics monitoring or instrumentation, check out some of the awesome lists on GitHub that cover:
- Incident response
- System administration (and another one on that topic)
- Metrics
- Monitoring
- SRE
Keep learning
Choose the right ESM tool for your needs. Get up to speed with the our Buyer's Guide to Enterprise Service Management Tools
What will the next generation of enterprise service management tools look like? TechBeacon's Guide to Optimizing Enterprise Service Management offers the insights.
Discover more about IT Operations Monitoring with TechBeacon's Guide.
What's the best way to get your robotic process automation project off the ground? Find out how to choose the right tools—and the right project.
Ready to advance up the IT career ladder? TechBeacon's Careers Topic Center provides expert advice you need to prepare for your next move.


