
Distributed computing and orchestration have solved many problems, but they also have created new challenges. While a Kubernetes cluster appears to a user to be a single computer, it is actually a set of independent nodes and multiple services that have been connected.
With this new way of building and running applications, your monitoring and observability strategies need to change—and so will the tools you use. Here are the most popular and most reliable open-source monitoring tools you can choose from when working with Kubernetes.
1. Kubelet
In a Kubernetes cluster, Kubelet acts as a bridge between the master and the nodes. It is the primary node agent that runs on each node and maintains a set of pods. Kubelet watches for PodSpecs via the Kubernetes API server and collects resource utilization statistics and pod and events status.
Kubelet fetches individual container usage statistics from Docker's Container Advisor (cAdvisor). But Kubelet also accepts PodSpecs provided through different mechanisms and ensures that the containers described in those PodSpecs are up and running. These aggregated pod resource usage statistics are exposed via a REST API.
2. Container Advisor (cAdvisor)
cAdvisor is a container resource usage and performance analysis agent; it's integrated into the Kubelet binary. cAdvistor auto-discovers all containers in a machine and collects statistics about memory, network usage, filesystem, and CPU. cAdvisor has native support for Docker containers. It does not operate at the pod level, but on each node.
Be advised, however: cAdvisor is a simple-to-use but limited tool, so if you are looking to store metrics for long-term use or perform complex monitoring actions, cAdvisor will not fit your needs.
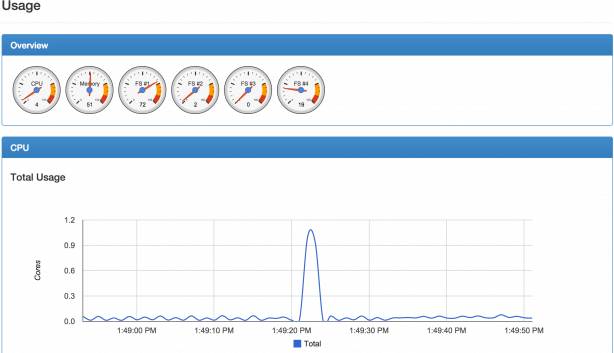 cAdvisor Dashboard shows live information about all containers on a physical machine.
3. Kube-state-metrics
Kube-state-metrics listens to the Kubernetes API server and generates metrics about the state of numerous Kubernetes objects, including cron jobs, config maps, pods, and nodes. These metrics are unmodified, unlike kubectl metrics that use the same Kubernetes API but apply some heuristics to display comprehensible and readable messages.
Kube-state-metrics uses the Golang Prometheus client to export metrics in the Prometheus metrics exposition format and expose metrics on an HTTP endpoint. Prometheus can consume the web endpoint.
This tool is not oriented toward performance and health but rather toward cluster-wide, state-based metrics such as the number of desired pod replicas for deployment or the total CPU resources available on a node.
4. Kubernetes Dashboard
Kubernetes Dashboard is a web-based, UI add-on for Kubernetes clusters. It has many features that allow users to create and manage workloads as well as do discovery, load balancing, configuration, storage, and monitoring. It is helpful for small clusters and for people starting to learn Kubernetes.
This tool offers different views for CPU and memory usage metrics aggregated across all nodes. It can also be used to monitor the health status of workloads (pods, deployments, replica sets, cron jobs, etc.). Installing Kubernetes Dashboard is quite easy and can be done using ready-to-use YAML files.
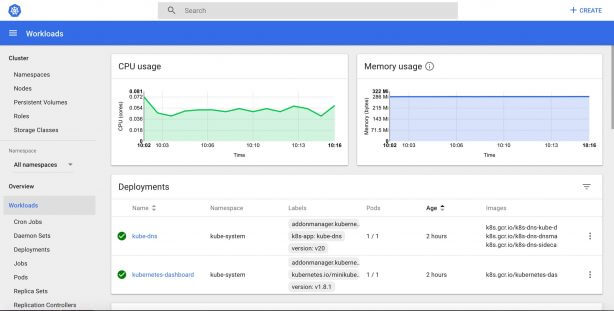 Kubernetes Dashboard is a general-purpose web user interface for Kubernetes clusters that includes management, troubleshooting, and monitoring features.
5. Prometheus
Prometheus is one of the most popular monitoring tools used with Kubernetes. It's community-driven and a member of the Cloud Native Computing Foundation. This project, developed first by SoundCloud and afterward donated to the CNCF, is inspired by Google Borg Monitor.
Prometheus stores all its data as a time series. This data can be queried via the PromQL query language and visualized with a built-in expression browser. Since Prometheus is not a dashboard, it relies on Grafana for visualizing data.
Version 1.0 of this tool was released in 2016, and it is becoming one of the most used Kubernetes monitoring tools. Other tools from the Kubernetes ecosystem, including Istio, include a built-in Prometheus adapter that exposes generated metrics.
Prometheus can be installed directly as a single binary that you can run on your host or as a Docker container. Running Prometheus on top of Kubernetes can be easily accomplished with the Prometheus Operator.
6. Jaeger
Jaeger is a tracing system released by Uber Technologies; it's used for troubleshooting and monitoring transactions in complex distributed systems.
With the rise of microservices and distributed systems, problems can include distributed context propagation, distributed transactions monitoring, and latency optimization. Jaeger addresses these problems as well as others that we can find in distributed systems.
Jaeger has native support for OpenTracing and addresses two main areas: networking and observability.
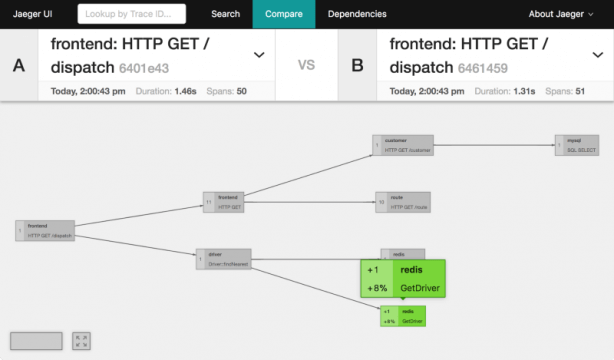 Implemented using React, Jaeger UI offers a modern user interface optimized to view large volumes of data.
7. Kubewatch
Kubewatch is a Kubernetes watcher that publishes event notifications in a Slack channel. This tool allows you to specify the resources you want to monitor. It is written in Golang and uses a Kubernetes client library to interact with a Kubernetes API server.
Using a simple YAML file, you can choose the resources to watch, including daemon sets, deployments, pods, replica sets, replication controllers, services, secrets, and configuration maps.
8. Weave Scope
Weave Scope is a zero-configuration monitoring tool developed by Weaveworks. It generates a map of processes, containers, and hosts in a Kubernetes cluster to help understand Docker containers in real time. It can also be used to manage containers and run diagnostic commands on containers without leaving the graphical UI.
If you are looking for a practical graphical tool to obtain a visual overview of your Kubernetes cluster—including the application, the infrastructure, and the connections among your cluster nodes—Weave Scope may help you.
This tool is extensible via some plugins.
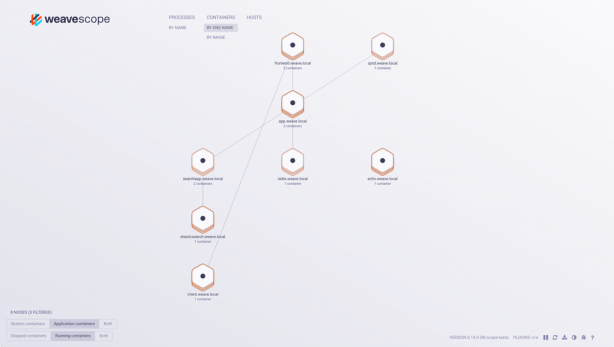 Weave Scope lets developers view real-time dashboards and contextual metrics, tags, and metadata associated with containers.
9. The EFK Stack
The EFK stack comprises Fluentd, Elasticsearch, and Kibana.
These tools work well with one another and together represent a reliable solution used for Kubernetes monitoring and log aggregation.
Fluentd collects logs from pods running on cluster nodes, then routes them to a centralized Elasticsearch. Then Elasticsearch ingests these logs from Fluentd and stores them in a central location. It is also used to efficiently search text files.
Kibana is the UI; the user can visualize the collected logs and metrics and create custom dashboards based on queries.
The EFK stack is useful for troubleshooting logs, dashboarding, and detecting issues as they come up—all in a user-friendly interface.
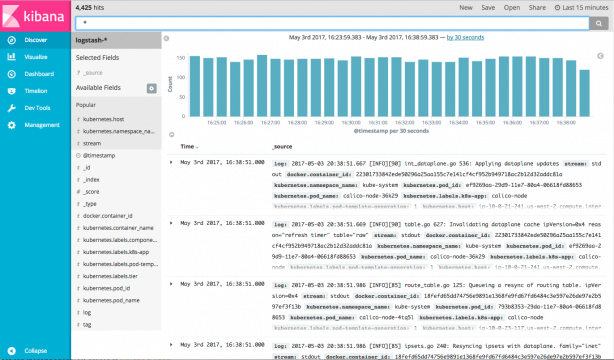 Kibana lets users search and visualize data using user-friendly graphs and charts.
Choose wisely
Choosing the right tool is important for successful monitoring and healthy systems. Some of the tools described above let you do more than just monitoring, including managing, troubleshooting, and tracing.
With the rise of container orchestration tools and new architectures such as microservices, monitoring is changing; it now involves new concepts such as observability.
That said, tools should be both chosen and used wisely, just as with the metrics you decide to employ. Google, for instance, has four golden signals of monitoring: latency, traffic, errors, and saturation. What are your golden signals of monitoring?
Keep learning
Choose the right ESM tool for your needs. Get up to speed with the our Buyer's Guide to Enterprise Service Management Tools
What will the next generation of enterprise service management tools look like? TechBeacon's Guide to Optimizing Enterprise Service Management offers the insights.
Discover more about IT Operations Monitoring with TechBeacon's Guide.
What's the best way to get your robotic process automation project off the ground? Find out how to choose the right tools—and the right project.
Ready to advance up the IT career ladder? TechBeacon's Careers Topic Center provides expert advice you need to prepare for your next move.
