
For many organizations, the very idea of DevOps is compelling, with its promise of improved productivity and reduced cost through the automation of manual process steps. The problem comes when the CFO asks, “So what?” or, perhaps more likely, “And what can we expect to get?”
What the CFO wants is numbers: dollars saved, velocity increased, reductions in time-to-market. All those things are exactly the promise of the DevOps Research and Assessment (DORA) group's newest report, “Forecasting the Value of DevOps Transformations: IT Done Right.”
Here are six key takeaways from the DORA report.
1. Metrics show the value of DevOps
As part of its research methodology, DORA considered metrics for before and after a DevOps adoption. The two core areas the group looked at were agility of throughput for software development, and reliability for operations. To measure agility, DORA looked at how often code was deployed. For reliability, the group looked at mean time to recovery, or MTTR, along with the change failure rates. The differences between groups that scored in the top (the high IT performers) and the bottom were striking.
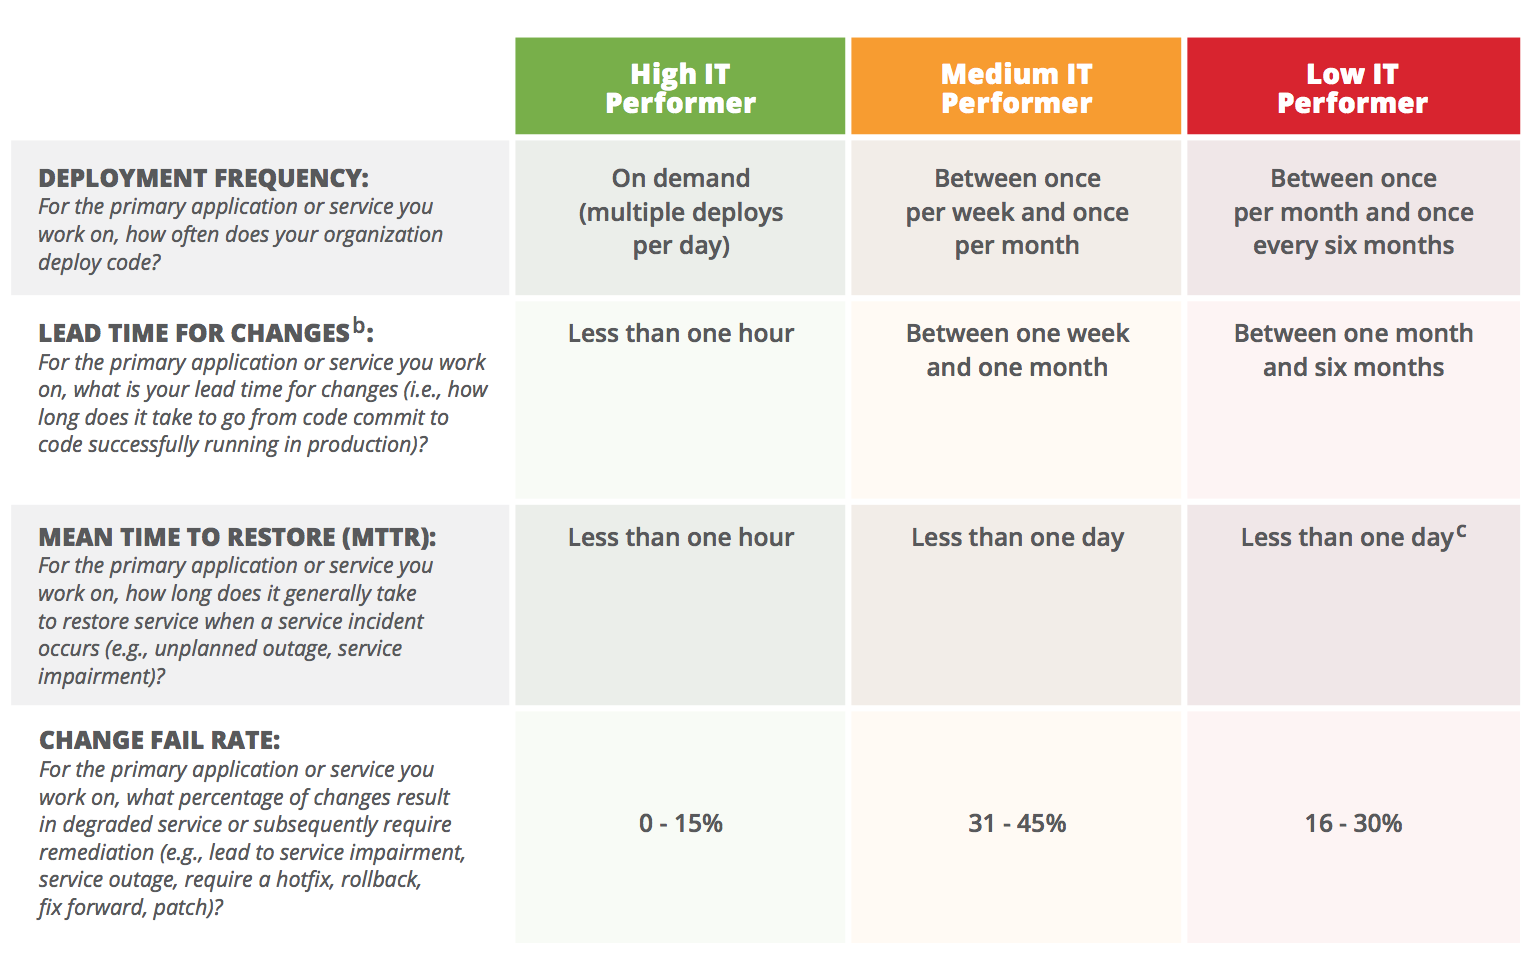
For a quick assessment of where your organization is, take a look at the chart, excerpted from the report (and used with permission). If your organization is a low or medium performer, the chance for improvement is striking.
Moving from improvement in these numbers to improvements in the bottom-line dollar, or at least productivity, is the next step. Luckily, the report has advice for modeling those as well.
2. DevOps reduces the cost of rework
Barry Boehm’s cost-of-change curve suggested that bugs found and fixed later cost more. At the time, the primary way of thinking about delivery was the waterfall, and the cost-of-change curve was focused on finding bugs before they got to production. DevOps turns that idea on its head.
Consider, for example, a bug that is coded and put into production in two hours, with the defect found two hours later, compared to a bug introduced in coding and found in test six weeks later. Fixing the first defect is a rollback and quick change; the second might take person-weeks to assess, triage, isolate, fix, and retest.
DevOps reduces the linear time to find problems with production monitoring. Problems found earlier are fixed faster. Techniques such as rollback and push-button deployment further reduce the cost of rework.
Realizing just how much time is spent in rework in the organization is critical, the report notes. Split that number in half, and that is a conservative estimate of the time-and-effort savings possible.
"So many organizations focus on cost savings, but this really is shortsighted. By thinking about how efficiencies and human capital can be reinvested back to the business—back to the product and delivering value to the customer—this is where real value lies. Truly innovative companies have recognized this and are leveraging it to their advantage."
—Nicole Forsgren, founder and CEO of DORA
So yes, spend less time reporting and fixing bugs with DevOps, but keep that time, and spend it developing and deploying new software. DORA’s estimate for a low to medium IT performer with 250 people in the IT organization is $2.8 million to $4.7 million in staff hours recaptured for productive work.
3. New-feature development becomes predictable
Say that an organization spends 40 percent of its time in rework. The DORA report suggests 20 percent as a reasonable goal, which means a 50 percent savings in time. Projects that were challenged are suddenly on-time; team members that were working late are suddenly done at 3 pm.
Of course, that means the software group can get more work done. Because DevOps and continuous delivery tend to lead to smaller batch sizes, small improvements and side projects become economically viable. Instead of arguing about funding for a project in various groups at various levels, the programmer can simply implement the idea, from concept to cash, in a few hours to a few days.
New-feature development has value that exceeds the cost of the programmers. Otherwise, the money would be better spent on bonds or savings that have less risk. The DORA report suggests including the value of that new software in the return on investment (ROI) calculation of a DevOps conversion. It also suggests a formula, based on the number of new disruptive ideas the team comes up with.
Perhaps most impressively, the DORA report includes not just advice on predicting increased uptime, but also a method for placing a dollar value on that uptime.
4. Downtime reduction can be predicted
It’s no surprise that DevOps means less downtime since testing rollouts is easier, as is rolling them back. The DORA report presents a formula to calculate the value of the new uptime. Here’s a quick summary:
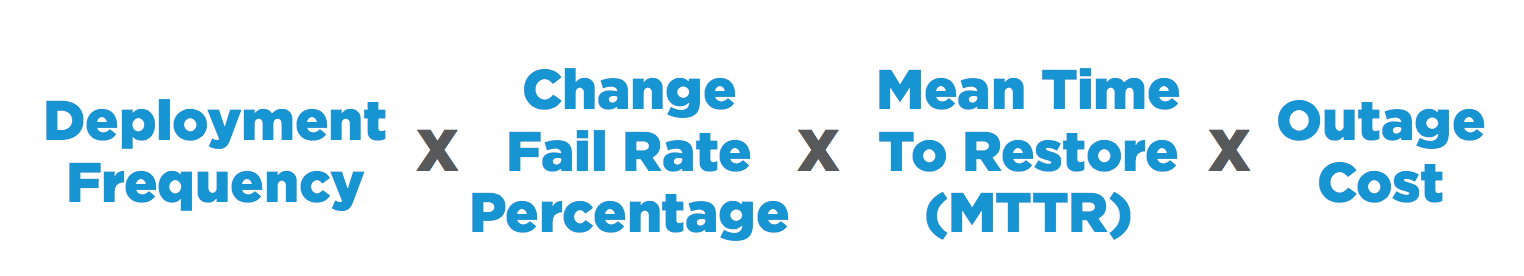
Outage cost is measured in dollars per second; the report states that a one-hour outage for critical application costs between $500,000 and $1 million. The higher figure is near $300 a second.
High-performing organizations can roll back in under an hour, the report notes. Low performers will take more than a business day. Meanwhile, the medium performers have the change fail nearly twice as often (at 38 percent versus 7.5 percent).
Transforming the organization to be high performing doesn’t just mean less rework and more software developed; it also means improved customer experience and better service. That means more orders flowing through the system, more claims processed, and more revenue generated.
5. The full cost of the move must be calculated
Moving to DevOps has an up-front cost, including hardware, training, software, consulting, and a fair bit of time “on a treadmill,” retooling existing process and products to fit into the new paradigm.
Predicting those costs accurately—at least within some reasonable limits—can make or break the validity of any ROI projection. That is where the DORA report really shines.
One of the most valuable parts of the whitepaper—because it identifies all the things a company might want to think about when it comes to the conversion to DevOps—is a list of sample prices for a large system transformation. A big insight in the paper is the cost of “running in place,” specifically the time and opportunity to retrain and retool the existing workforce in DevOps, Kanban, and agile methods. That number was just over half of the total.
6. Emphasize the payback period
ROI numbers, while eye-popping, generally do not create an emotional response. Payback period, however, might do that.
In traditional investing, payback is the point where new equipment has generated the same amount of free cash flow as its cost. In the example in the whitepaper, the top-line value of the new work is $74 million a year, while the cost is close to $5 million. Dividing the cost by payback, authors get a period of 27 days to generate payback. After that, the returns are all profit.
Of course, it might take six months or a year to get the new processes fully installed, and therefore ready to start the clock on those 27 days.
By the end of the paper, readers have the tools to do all of this math themselves, along with the realistic guidance of just how much improvement is possible.
Make your own predictions
That’s just a taste of the modeling tools listed in the report, which also includes notes on how to classify your own organization, what to expect, how to calculate ROI, and more.
"The report provides cost and value estimates that make up ROI calculations, but more importantly, it shows teams and organizations how they can think about their own ROI by providing detailed steps along with industry benchmarks and averages."
—Nicole Forsgren
The goal: To help teams think through the issues, using the research as a jumping-off point for their own work.
Which is the most likely next step: To determine how much value-add is possible with a move to (a more) DevOps-like way of working. Download the report, leave a comment—and get to work.
Image credit: Flickr
Keep learning
Take a deep dive into the state of quality with TechBeacon's Guide. Plus: Download the free World Quality Report 2022-23.
Put performance engineering into practice with these top 10 performance engineering techniques that work.
Find to tools you need with TechBeacon's Buyer's Guide for Selecting Software Test Automation Tools.
Discover best practices for reducing software defects with TechBeacon's Guide.
- Take your testing career to the next level. TechBeacon's Careers Topic Center provides expert advice to prepare you for your next move.
