
On the surface, you probably know what continuous testing is all about: Running tests at each stage in the pipeline, giving your team feedback to improve quality and increase velocity, triggering tests automatically at critical junctures such as at code check-in time. You understand that the faster defects are found, the faster your team can address them.
But continuous testing doesn’t happen by itself, as Malcolm Isaacs explains in his new eBook, Continuous testing in Micro Focus: Increasing delivery speed and quality for agile and DevOps teams. It requires not just an understanding of these steps, but a significant shift in thinking if development teams are to succeed.
In the following ebook excerpt, Isaacs describes the techniques that evolved as development teams at Micro Focus adopted continuous testing throughout the development process. Here are the takeaways.
Continuous testing at Micro Focus: How it works
At Micro Focus, we have many business units, each of which develops a large number of products. Each product has its own idiosyncrasies and quirks, and there are many different requirements to take into consideration. In recent years, all of our product teams have gone through an agile transformation, with some product teams working with DevOps.
Although there are differences between each product’s implementation, each of these teams has several common factors. Most notably, they all work with a delivery pipeline and a continuous integration server, and they all implement continuous testing. This is how the continuous integration server deploys the various servers for one of our products:
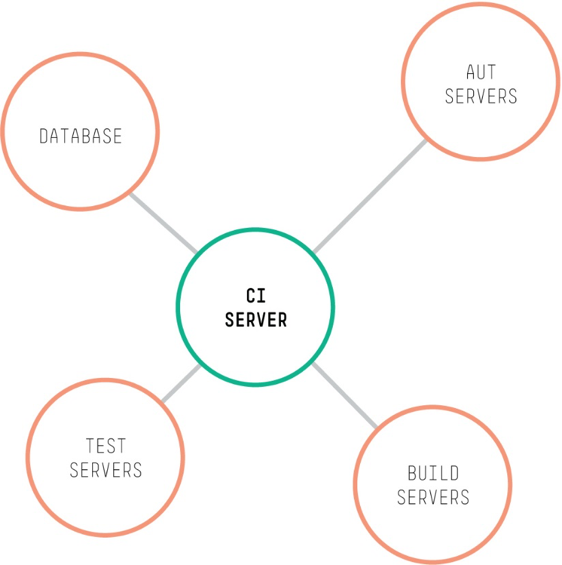
We use the following servers:
- CI (Continuous Integration) Server – All of our delivery pipelines are implemented with Jenkins.
- AUT (Application Under Test) Servers – This is where the application to be tested is deployed.
- Build servers – The builds are performed here.
- Test servers – The AUT is tested by running tests from the test servers, typically by issuing API calls, or driving a browser on the test server that accesses the AUT.
- Database – The database(s) that most applications require.
Here’s the journey through that product’s pipeline:
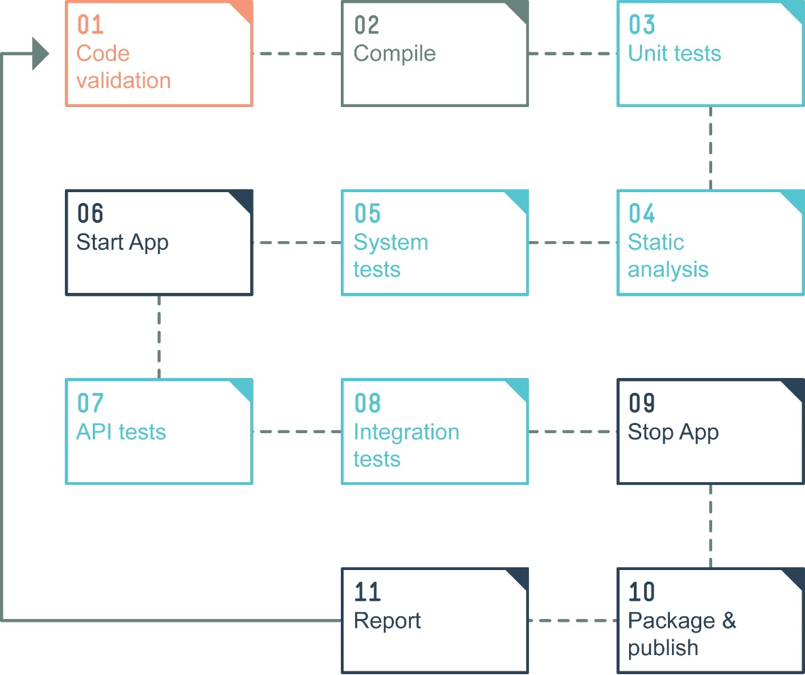
- Code validation – When code is checked into the source code repository, a quick check runs to make sure that the code compiles and passes some tests. If the code doesn’t compile or fails a test, it won't be checked in. This is the concept of gated check-in.
- Compile – The code is compiled.
- Unit tests – We run a lot of unit tests after every compilation.
- Static analysis – We also run static analysis on the source code to find issues with code, and with front-end code such as HTML and CSS
- System tests – Component tests are run to ensure that the different parts of the application are working. This product’s pipeline doesn’t require that the whole system be deployed to perform the system tests.
- Start app – Once the system tests have completed, the application is deployed and started so that more extensive testing can take place.
- API tests – Test the API layer of the application.
- Integration tests – Test the end-to-end functionality of the application, typically through the GUI.
- Stop app – Stop the application.
- Package and publish – Create a deployable package that can be installed on the customer’s site.
- Report –Report the results of the build and the tests, and update the various dashboards.
Now let’s look at the process within a typical software pipeline.
Understanding the flow through the pipeline
Developers and testers usually start a task by meeting with the product owner to define and refine the requirements. By the end of the session, everyone understands what they need to do to complete the task.
Most importantly, everyone understands the criteria by which the task will be judged to be complete. The developers start writing code and will integrate it with the source code repository. This is where code enters the pipeline. In parallel, the testers work on automating testing from the beginning. Let’s look at what happens when the developer attempts to commit code.
Committing code to the source code management system
Following informal and ad-hoc testing that the developers perform on their local workstations, the developer runs a quick validation suite consisting of basic and complex validation tests that are required to pass before the code can be checked into GitHub. (Within Micro Focus, we use GitHub as our source-code management (SCM) system.)
To automate this preliminary validation, we use the open source Verigreen plug-in to prevent bad code from getting into the main trunk. If there’s a problem, it alerts the developer who attempted the commit so the developer can fix the problem without affecting the rest of the team.
If the code passes preliminary testing, it is checked into the main source trunk.
Successful commit triggers Jenkins to do a build
When code is successfully committed, it triggers a comprehensive build, causing the entire code base on the main trunk to be compiled. Because a pre-check has already run on the code, the compilation usually succeeds. In the rare event that the compilation fails, the developer who performed the last check-in is notified, and must fix the code as soon as possible. When the build fails, the trunk is locked, and no more changes are allowed in until the problem has been resolved. This prevents problems from accumulating, and ensures that the build and its trunk is kept green.
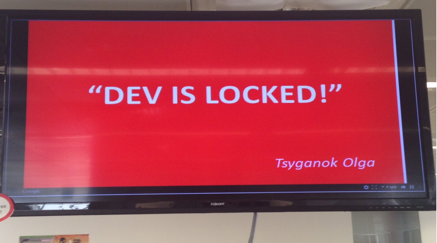
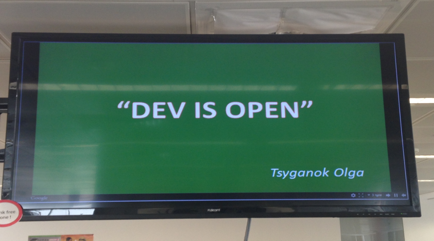
Teams take the status of their build and code base seriously, and they have dedicated monitors that always display the status of the source code repository. Here’s an example of a monitor showing that senior test engineer Olga locked her product’s trunk because of a bad build. The monitor continues to display the message, and no code can be checked in until the problem has been resolved. At this point, she’ll open it back up, and you'll see "DEV IS OPEN."
In parallel to the monitor, emails and other alerts are sent to make sure that everyone understands what is happening in more detail, and that someone has been assigned to fix the problem.
Unit and system tests get run
As soon as the build has completed, Jenkins runs a suite of automated tests that have been pre-configured to run. Typically, the set of tests is designed to complete execution quickly so that the team gets feedback on the build’s quality as soon as possible.
The test suite consists primarily of API-level unit and functional tests, along with some performance and security tests. These must complete quickly because rapid feedback is a priority. The tests run on a test environment that is automatically deployed after the build.
As with a failed build, the trunk is locked if a test fails. If that happens, it's usually the result of a serious problem that could not have been picked up in the developer’s environment.
The goal is to complete the process and report the results within 15 minutes of the commit that triggered the build.
The full build gets deployed to test
If the tests succeed, Jenkins performs a full build on all of the software. It deploys a test environment and then deploys the compiled and built code to the test environment. In some cases, this might require the approval of someone from the team, but whether someone has to approve this step manually or it happens automatically, the deployment itself is done automatically, without having to manually copy or modify files.
Integration tests and regression tests run
Once the test environment is ready and configured, with the application installed, configured, populated with test data, and running, more extensive end-to-end tests run, and the results are reported back to a dashboard.
We design the full build, deployment, and tests to take no longer than an hour and a half to run to completion.
Nightly builds continue
In addition to the builds triggered by developers committing source code to the repository, we also run a more comprehensive, long-running test each night. Some products with more lengthy tests might do this on a weekly basis. These tests are more detailed, and often involve intensive load and performance testing, full regression testing, upgrade testing, and testing across the full product availability matrix (PAM) of supported operating systems and environments.
We don’t limit the amount of time it takes for the nightly build and its tests, although we try to keep it to eight hours or less so that the results are ready by the time the team starts work the next morning. We monitor the progress continuously through our dashboards.
End game: Deployment to production
If the previous batch of tests succeeds, the software can be deployed to production. In practice, however, most of our products do not deploy immediately after the tests have succeeded. The most common scenario is that we first deploy the product to a staging area that is identical to the production environment, where we run extensive tests.
If we’re satisfied with the overall quality, we deploy to production at a time that causes the least disruption to end users. As with the deployment to the test environment that we saw previously, the process might need to be triggered manually. But because we’ve adopted the concept of treating our infrastructure as code, the process of deploying to production is completely automatic, as is the configuration of the application and its environment.
Production tests run
Testing doesn’t stop once we deploy to production. One of the first things that happens after deployment is we run a series of tests to ensure that the deployment actually succeeded. These include end-to-end functional tests, API tests, security tests, and performance tests. Many of these tests are automated, but we also do manual end-to-end testing in production.
Application monitoring
As long as the application is live, we constantly monitor it for performance, security and user experience. The information we gather helps us understand how our users work with our products in practice, which helps us to optimize our products’ features and optimize the testing that we perform on them. This is an essential component of the feedback loop that continuous testing enables.
Testing everywhere
So that's it in a nutshell: How testing is performed continuously throughout the pipeline at Micro Focus. Although it sounds complex, it follows a pattern of:
- Running short tests to give a very quick response to the development team, which commits changes to the source code repository about the quality of the change.
- Running a more extensive set of automated tests
- Running an extensive nightly or weekly set of tests
- Testing and monitoring the deployment to production
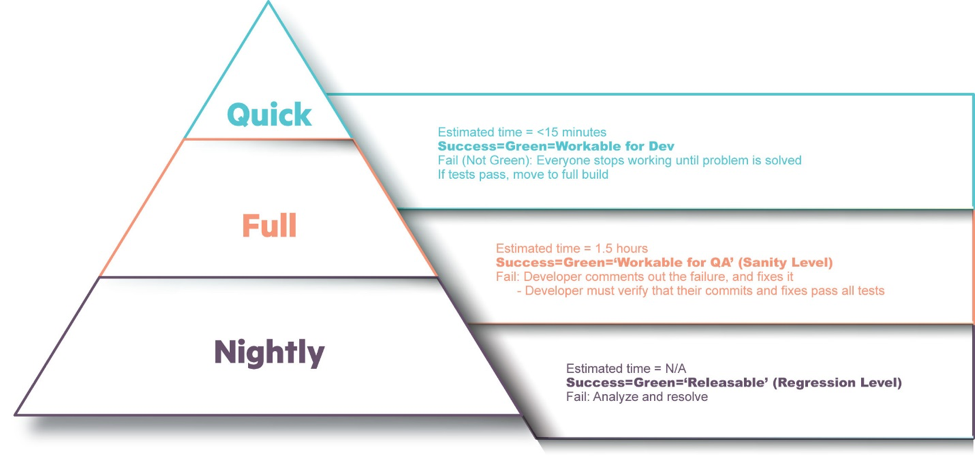
Here is a visual representation of how continuous integration testing starts small and grows over time:
That's how Micro Focus does continuous testing. For a more detailed look at how we execute continuous testing and how you can too, download my free ebook, Continuous testing in Micro Focus: Increasing delivery speed and quality for agile and DevOps teams.
Share how your team us practicing continuous testing in the comments section. What have you learned?
Keep learning
Take a deep dive into the state of quality with TechBeacon's Guide. Plus: Download the free World Quality Report 2022-23.
Put performance engineering into practice with these top 10 performance engineering techniques that work.
Find to tools you need with TechBeacon's Buyer's Guide for Selecting Software Test Automation Tools.
Discover best practices for reducing software defects with TechBeacon's Guide.
- Take your testing career to the next level. TechBeacon's Careers Topic Center provides expert advice to prepare you for your next move.
