
As software systems become more distributed and interconnected, you need to ensure that the software works well when operating live in production—what I call software "operability"—and you need to be able to observe its behavior.
With the goal of improving mutual understanding of software systems through collaboration—a true DevOps approach—here are five practical ways your team can collaborate to enhance the operability of your software systems.
1. Collaborate on logging with event IDs to boost observability and awareness
Problem 1: Lack of observability for distributed systems.
Modern software requires teams to understand logging as a first-class concern. Using log traces from multiple machines is key to observing the behavior of runtime systems. With modern logging, you log to file (for servers) or STDOUT (for containers and serverless). The logs are then aggregated automatically into a central, searchable log store that's accessible with a browser UI and an HTTP API.
In the past, logging was seen as just a way to deal with errors, but this is a very ineffective use of logging. Since 2007, I have treated logging as a rich trace of application behavior, using unique identifiers such as an enum to represent distinct states that I also call event IDs. Examples of event IDs could be ServiceStarting, DatabaseConnectionOpened, PostcodeLookupFailed, NewUserRegistered, etc.
OpsLogger is a good example of a logging library that uses techniques similar to the event ID approach.
By defining and collaborating on this set of "interesting" events, teams come to better understand the system they are building and running. No longer is logging "just for errors"; logging leads to vital ongoing insight into the runtime execution of the system.
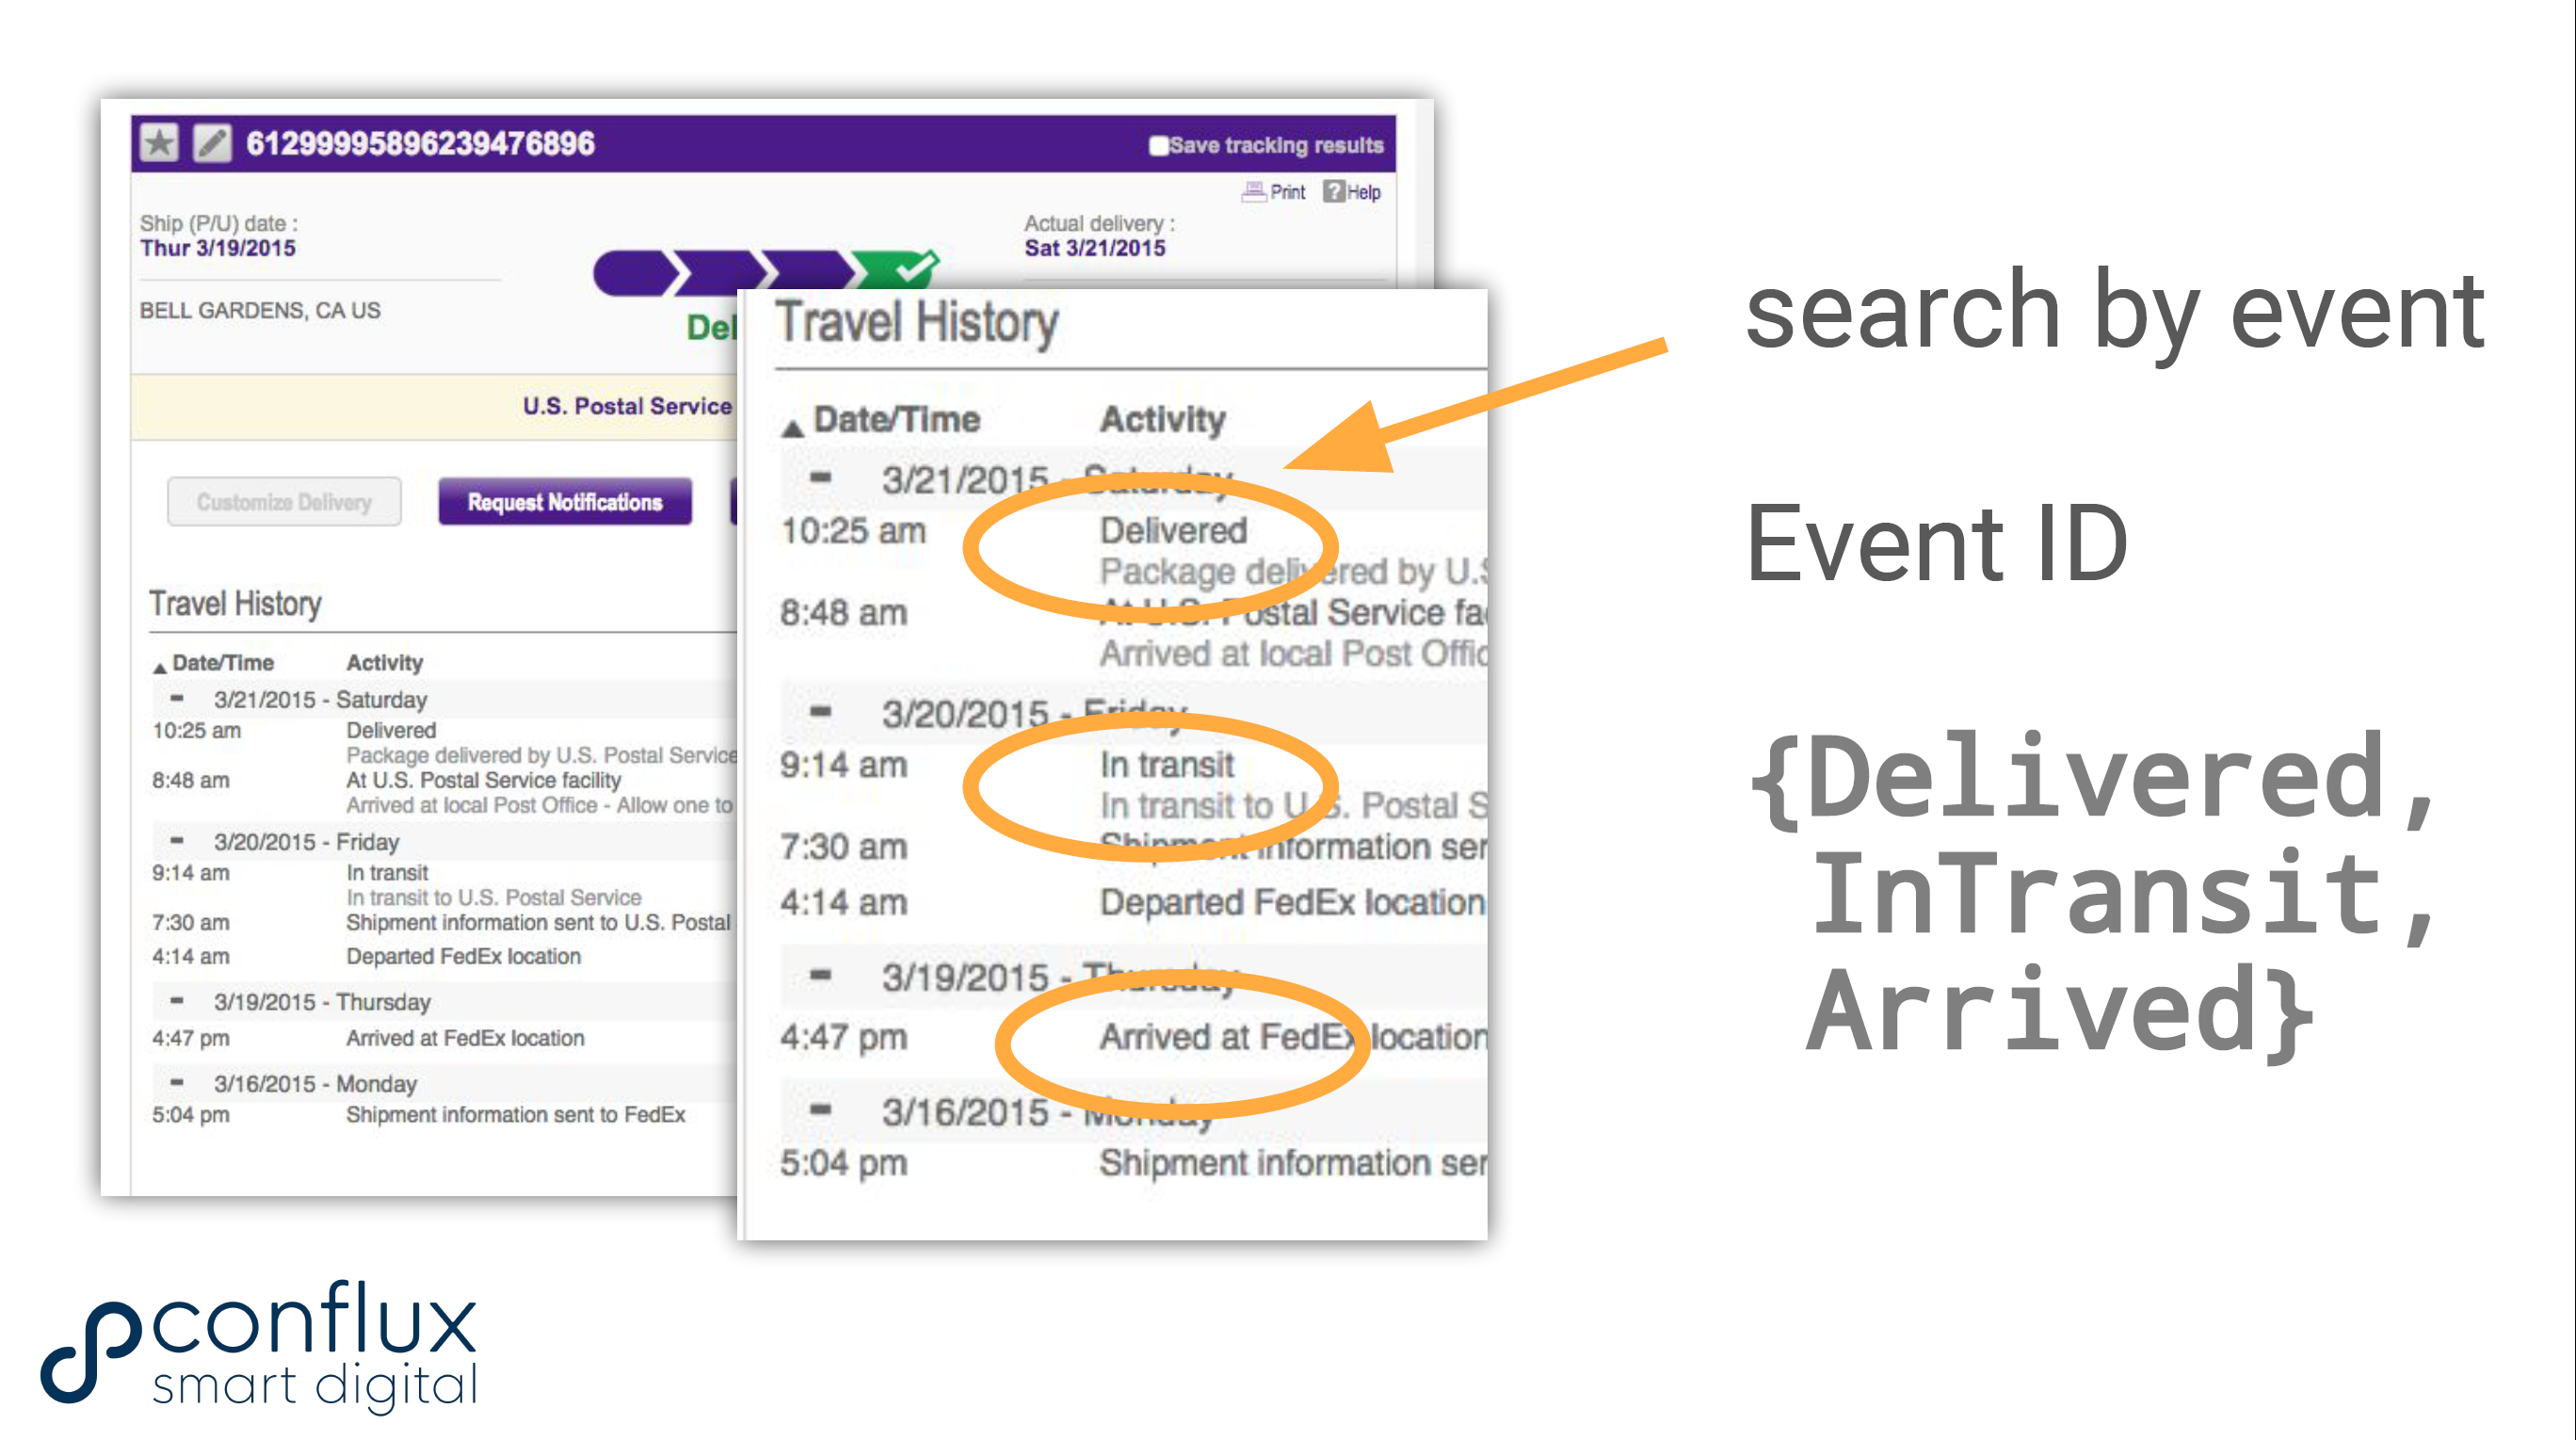
When shipping a parcel, the "interesting" event IDs might be ArrivedAtDepot, InTransit, and Delivered. We define equivalent states for our software that are interesting for all the teams involved. Source: Conflux
You log only when you're representing an "interesting" software state, so you're forced to consider why you're logging at a particular point in the code. This in turns avoids what one might call "logarrhea"—too many arbitrary log lines. Combined with a structured logging library, you have a rich source of operational intelligence for our software, validated and curated by teams working with the systems.
Takeaway 1: Use enum-based event IDs with logging to explore system runtime behavior and fault conditions.
2. Use Run Book dialog sheets to identify operational requirements early
Problem 2: Operational aspects not addressed, or addressed too late in the cycle.
Too often, operational aspects of the software system are addressed either late in the process or not at all, leading to problems in the production environment. A technique I have found valuable with many teams is to use a Run Book dialog sheet, a large (A1 size) printed paper sheet with a set of typical operational criteria listed. There's also space for the team to write down answers or questions. The Run Book dialog sheet is licensed under Creative Commons Share Alike, so it's free to use.
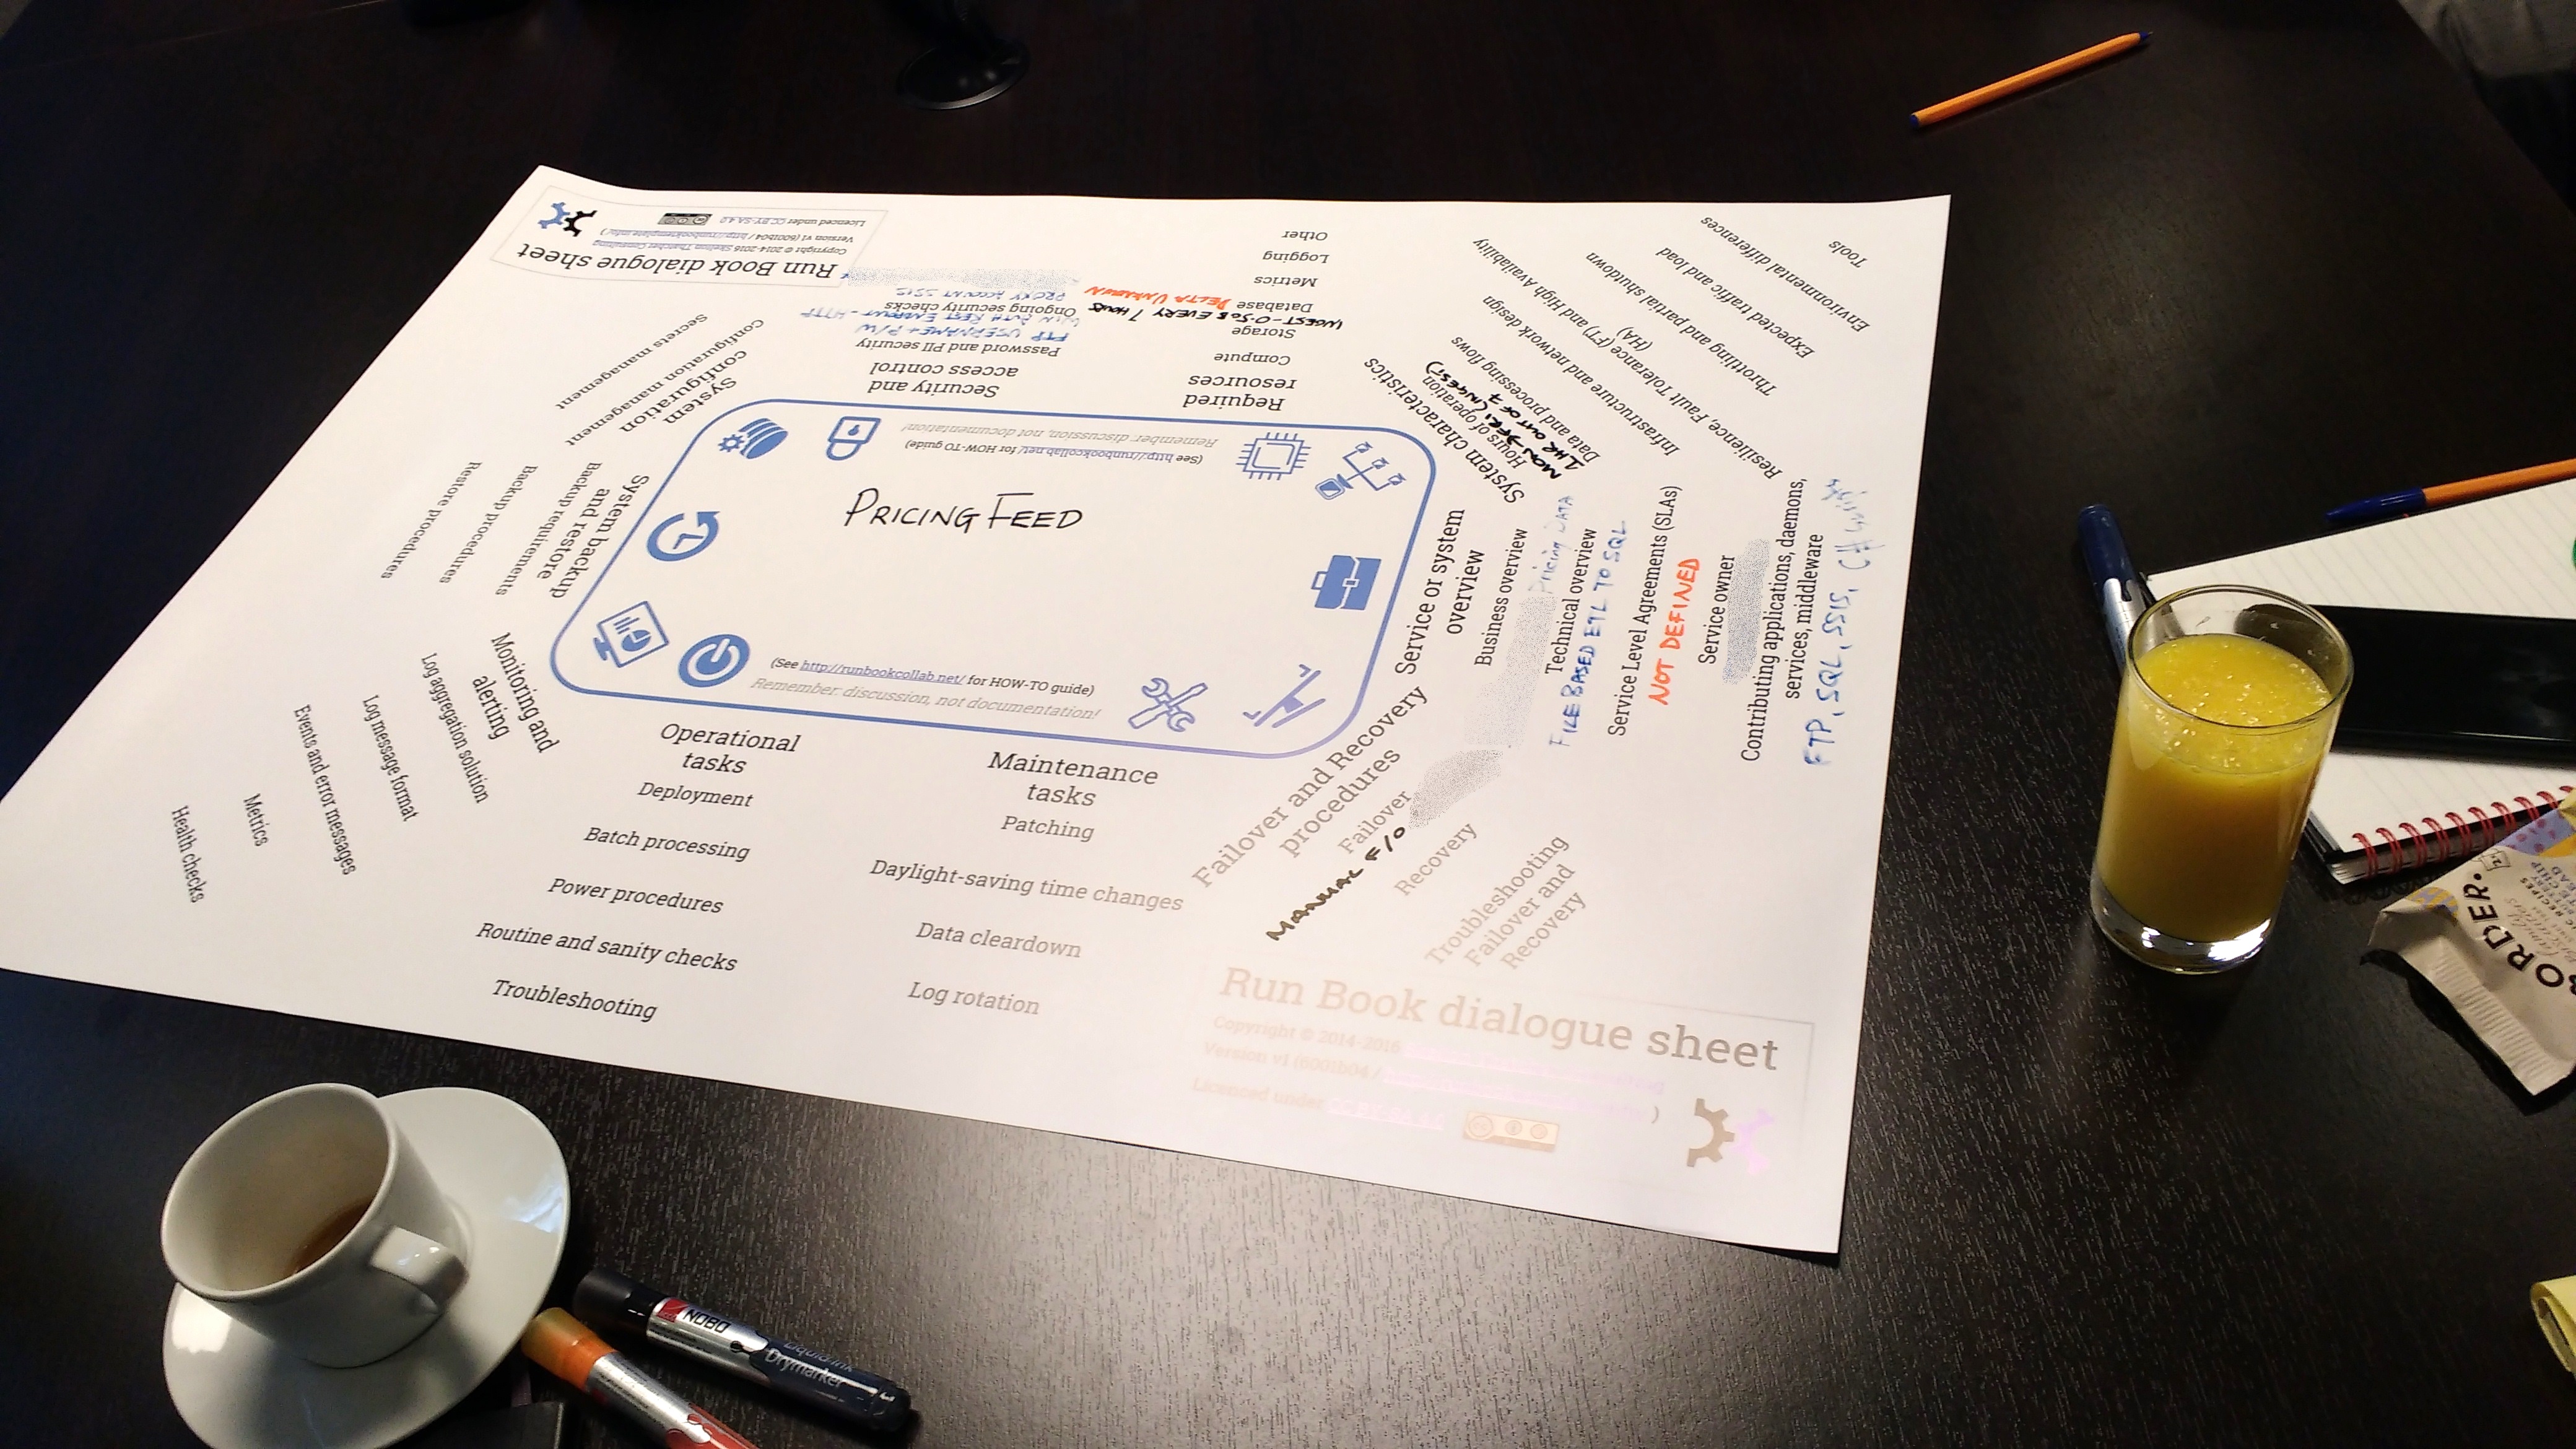
The supersized A1 format of the Run Book dialog sheet encourages round-the-table team collaboration on operational aspects. Source: Conflux
The Run Book dialog sheet technique works best when the dev/delivery team takes the lead on defining the initial set of operational features, because the team typically has to reach out to more operations-focused teams to fill in the details. The software design may change at this point to better support operability.
Takeaway 2: Use Run Book dialog sheets to explore and establish operational requirements as a team, around a physical table, together.
3. Collaborate on endpoint health checks
Problem 3: "Why has my deployment failed again?"
Deployment failures are really boring, particularly when they're due to environment misconfigurations. One practical way to remove much of the ambiguity from deployment problems is to use HTTP-based health checks for every component.
For every separate running component or service, you have a health-check endpoint that returns HTTP 200 if the service is healthy and HTTP 500 if the service is unhealthy. You can add more nuanced responses too.
Provide helper endpoints for services such as databases or queues that have no native HTTP capability. This lets you wire up a standard environment dashboard really easily, showing the health of all components at a glance.
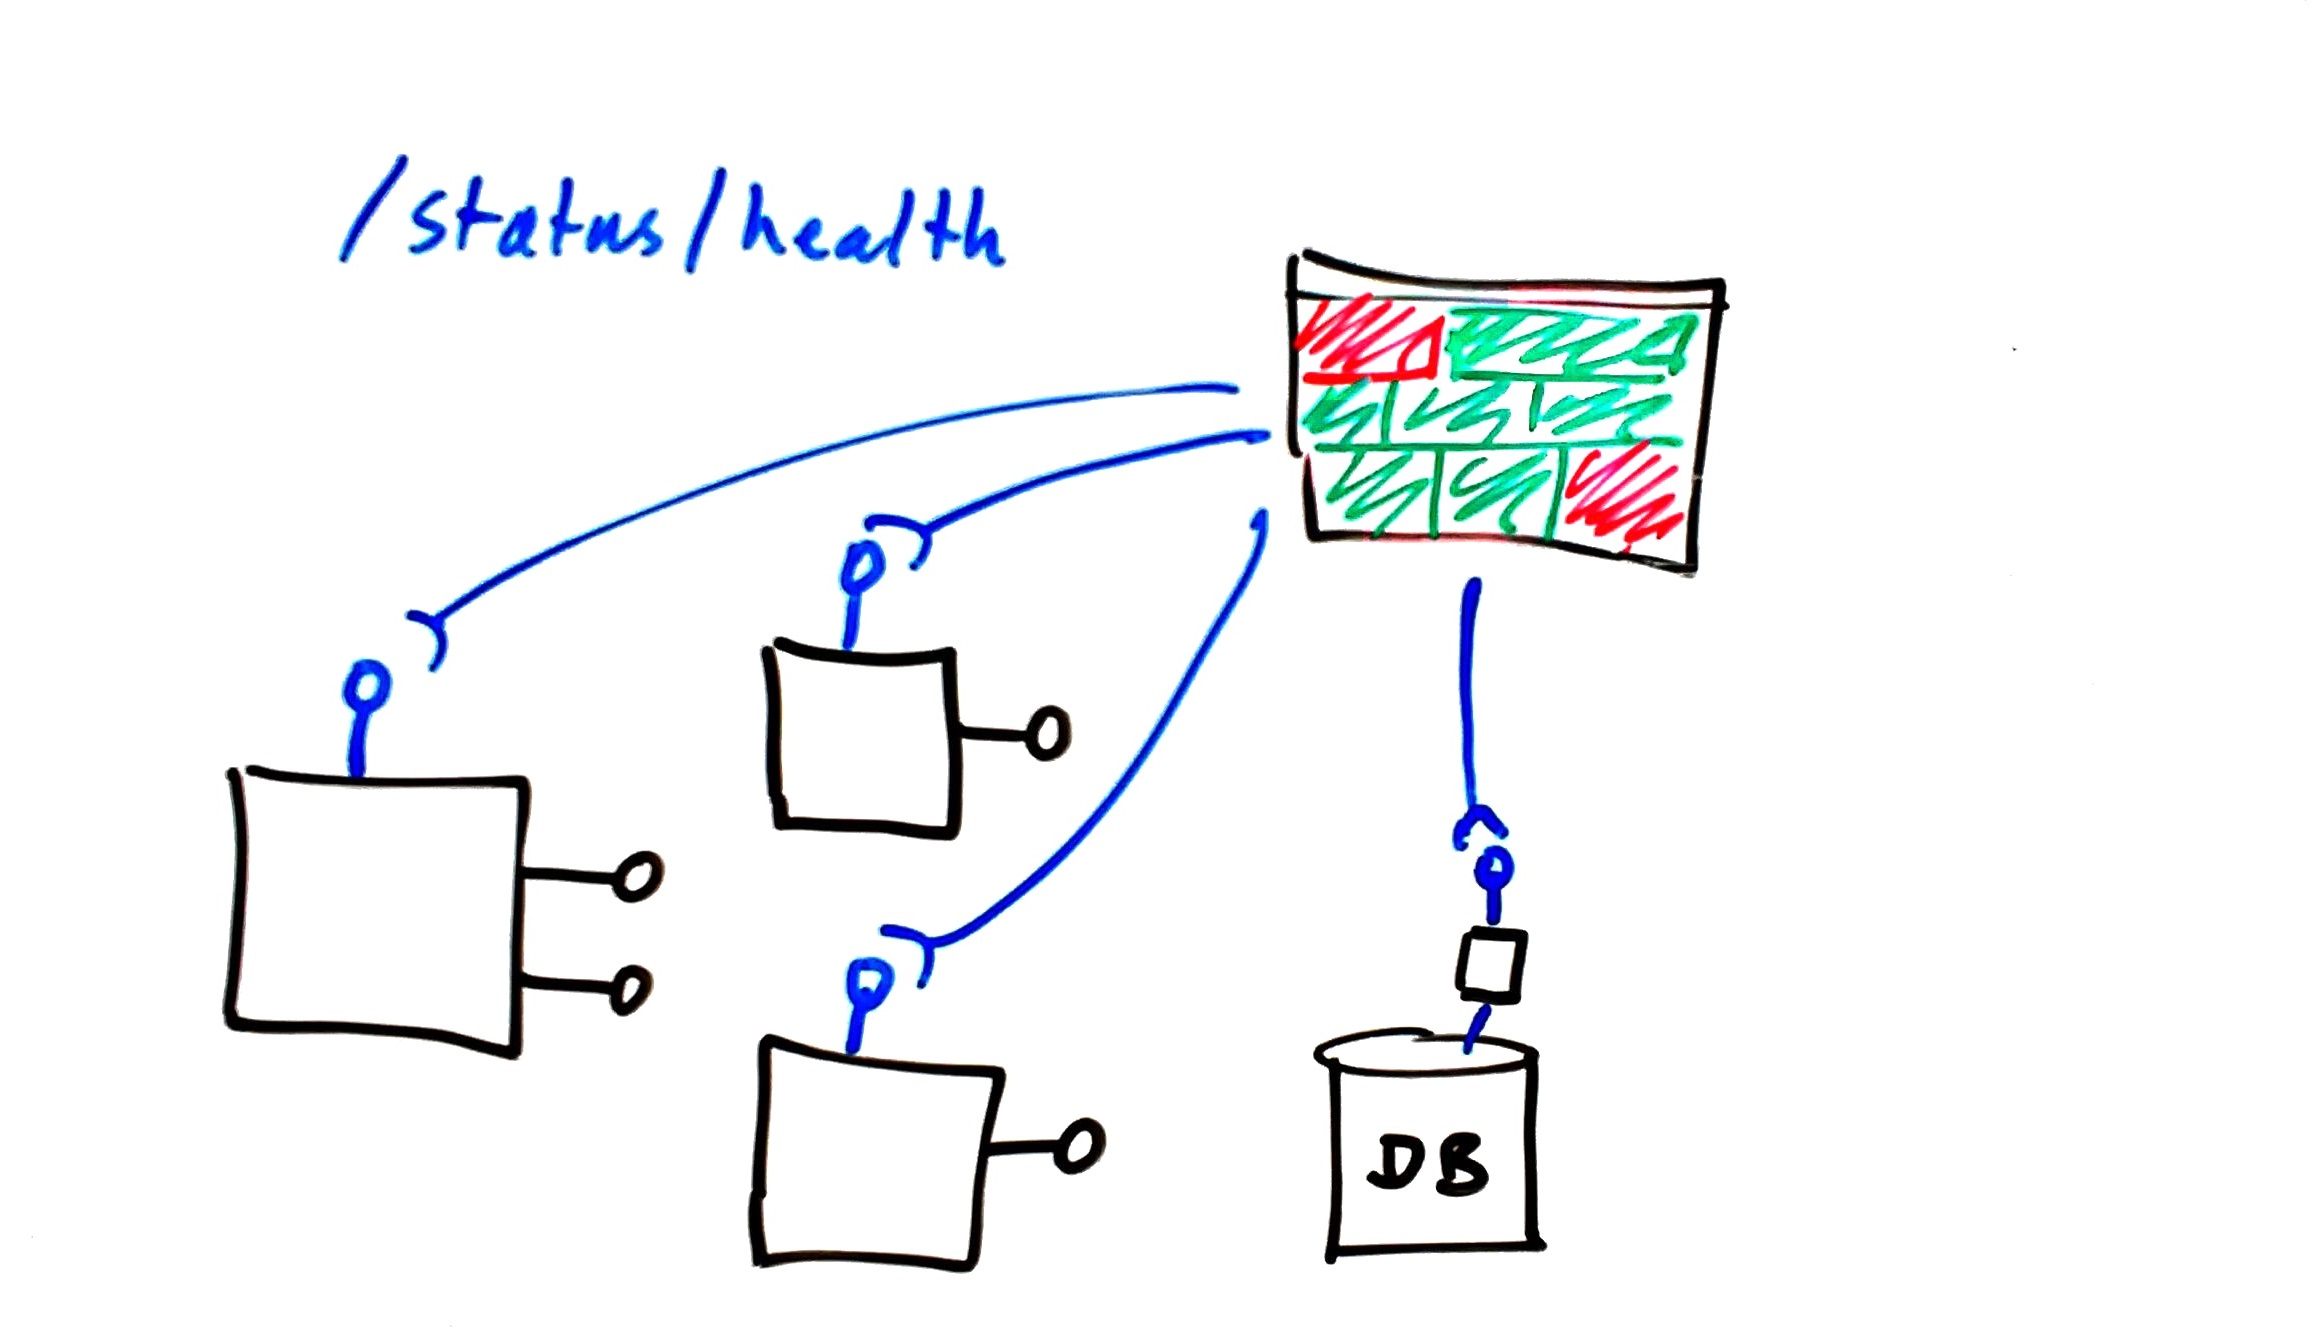
Provide a small helper service to provide a health check endpoint for a component without native HTTP, such as a SQL database. Source: Conflux
This technique is particularly powerful when teams collaborate on the conditions for "healthy" and "unhealthy." Why does component X need to see that external service? Why does component Y need four virtual CPU cores or a GPU? You very soon discover interesting runtime dependencies through the process of defining the health-check logic.
Takeaway 3: Use endpoint health checks (with HTTP 200/500 responses) to explore component health conditions.
4. Collaborate on correlation IDs for rich transactional tracing
Problem 4: "Which containers/servers handled the request?"
As the number of processing nodes—servers, containers, IoT devices, availability zones—increases, you need to be able to reconstruct a request as an execution trace across multiple nodes. Perhaps one or more nodes are faulty or misconfigured, such as having the wrong version of a container image deployed.
You need to understand exactly where processing delays occur so you can troubleshoot more quickly and resolve the bottlenecks. You can do this using correlation IDs, near-unique identifiers that you inject at the edge of the system and then pass down through downstream components.
Again, if you collaborate among different teams on the trace details, you gain rich operational insights into the running software system. Correlation IDs should help dev teams build better software every week, rather than merely being a special feature of the production environment.
Takeaway 4: Use correlation IDs to trace execution (synchronous and asynchronous) and increase team awareness about system behavior.
5. Use lightweight user personas to capture the needs of testers and ops people
Problem 5: Software is difficult to operate—poor UX for ops.
In your efforts to meet the needs of the primary users of your systems, you sometimes forget to meet the needs of secondary or internal users such as testers, release engineers, and ops people, which is a problem. If your software is difficult to test, difficult to deploy, and difficult to operate, you risk losing money or reputation fighting the software to resolve the problem when there is a failure of some kind.

Addressing the needs of secondary users helps to improve operability. Source: Conflux
You can use lightweight user personas to characterize the needs (motivations, goals, frustrations) of testers, release engineers, ops people, and others who need to interact with the software as part of their job.
Employed well, user personas help to build empathy with other people so you can discover ways in which the software needs to work better in production (or before production). By making software more testable, releasable, and operable, you improve operability overall and make the software more resilient—wins all around.
Takeaway 5: Use lightweight user personas to make sure that the needs of secondary users (ops, testers, etc.) are met during software development.
Create your operability action plan
Focus on operability, and you'll create software systems that work well in production. But to achieve good operability, you must encourage collaboration between different teams by using practical, team-friendly techniques.
These five techniques have worked well for teams around the world, and they'll work for you too. Want to know more? See the video below, from my presentation at Continuous Lifecycle London 2018.
I'll be discussing more on these techniques in my upcoming book, Team Guide to Software Operability, which I am co-authoring with Rob Thatcher. Read the free sample chapter to explore the Run Book dialog sheet technique in more detail, and follow @Operability on Twitter for updates.
Keep learning
Take a deep dive into the state of quality with TechBeacon's Guide. Plus: Download the free World Quality Report 2022-23.
Put performance engineering into practice with these top 10 performance engineering techniques that work.
Find to tools you need with TechBeacon's Buyer's Guide for Selecting Software Test Automation Tools.
Discover best practices for reducing software defects with TechBeacon's Guide.
- Take your testing career to the next level. TechBeacon's Careers Topic Center provides expert advice to prepare you for your next move.
